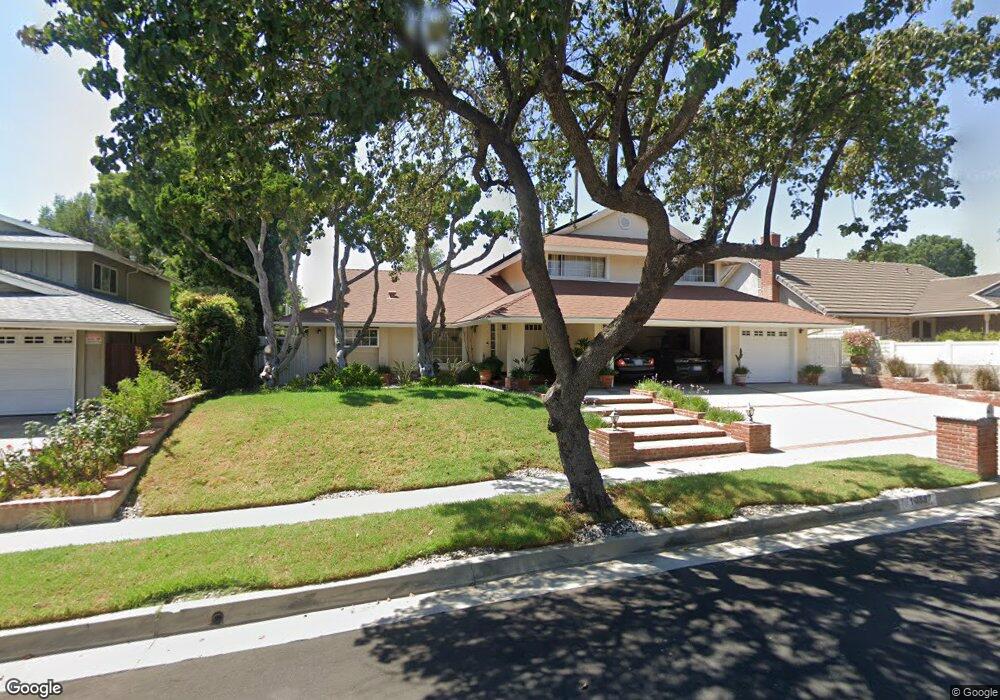
10857 Topeka Dr Porter Ranch, CA 91326
Porter Ranch NeighborhoodEstimated Value: $1,246,610 - $1,487,000
5
Beds
4
Baths
2,709
Sq Ft
$494/Sq Ft
Est. Value
About This Home
This home is located at 10857 Topeka Dr, Porter Ranch, CA 91326 and is currently estimated at $1,337,153, approximately $493 per square foot. 10857 Topeka Dr is a home located in Los Angeles County with nearby schools including Valley Academy of Arts & Sciences, Northridge Academy High, and Topeka Charter School For Advanced Studies.
Ownership History
Date
Name
Owned For
Owner Type
Purchase Details
Closed on
Aug 25, 2016
Sold by
Fernando Nihal Angelo
Bought by
Fernando Nihal Angelo and Fernando Kathy
Current Estimated Value
Home Financials for this Owner
Home Financials are based on the most recent Mortgage that was taken out on this home.
Original Mortgage
$547,500
Interest Rate
3.45%
Mortgage Type
New Conventional
Create a Home Valuation Report for This Property
The Home Valuation Report is an in-depth analysis detailing your home's value as well as a comparison with similar homes in the area
Home Values in the Area
Average Home Value in this Area
Purchase History
| Date | Buyer | Sale Price | Title Company |
|---|---|---|---|
| Fernando Nihal Angelo | -- | Ticor Title Company Of Ca |
Source: Public Records
Mortgage History
| Date | Status | Borrower | Loan Amount |
|---|---|---|---|
| Closed | Fernando Nihal Angelo | $547,500 |
Source: Public Records
Tax History
| Year | Tax Paid | Tax Assessment Tax Assessment Total Assessment is a certain percentage of the fair market value that is determined by local assessors to be the total taxable value of land and additions on the property. | Land | Improvement |
|---|---|---|---|---|
| 2025 | $8,316 | $661,187 | $293,594 | $367,593 |
| 2024 | $8,201 | $648,224 | $287,838 | $360,386 |
| 2023 | $8,047 | $635,515 | $282,195 | $353,320 |
| 2022 | $7,682 | $623,055 | $276,662 | $346,393 |
| 2021 | $7,577 | $610,839 | $271,238 | $339,601 |
| 2020 | $7,648 | $604,576 | $268,457 | $336,119 |
| 2019 | $7,355 | $592,723 | $263,194 | $329,529 |
| 2018 | $7,199 | $581,102 | $258,034 | $323,068 |
| 2016 | $6,862 | $558,539 | $248,015 | $310,524 |
| 2015 | $6,763 | $550,150 | $244,290 | $305,860 |
| 2014 | $6,788 | $539,374 | $239,505 | $299,869 |
Source: Public Records
Map
Nearby Homes
- 19040 Celtic St
- 18937 Olympia St
- 18779 Willowtree Ln
- 10621 Vanalden Ave
- 11215 Wilbur Ave
- 10900 Des Moines Ave
- 10808 Des Moines Ave
- 11017 Baird Ave
- 19253 Kenya St
- 19140 Lahey St Unit 4
- 19137 Index St Unit 9
- 18501 Germain St
- 19225 Index St Unit 2
- 19237 Index St Unit 4
- 19235 Index St Unit 3
- 10557 Reseda Blvd
- 18772 Algiers St
- 18438 Los Alimos St
- 19500 Tribune St
- 11357 Yolanda Ave
- 10901 Topeka Dr
- 10849 Topeka Dr
- 10854 Springfield Ave
- 10900 Springfield Ave
- 10846 Springfield Ave
- 10911 Topeka Dr
- 10841 Topeka Dr
- 10856 Topeka Dr
- 10900 Topeka Dr
- 10848 Topeka Dr
- 10910 Springfield Ave
- 10840 Springfield Ave
- 10908 Topeka Dr
- 10840 Topeka Dr
- 10919 Topeka Dr
- 10918 Springfield Ave
- 10865 Springfield Ave
- 10855 Springfield Ave
- 10916 Topeka Dr
- 10907 Springfield Ave
Your Personal Tour Guide
Ask me questions while you tour the home.