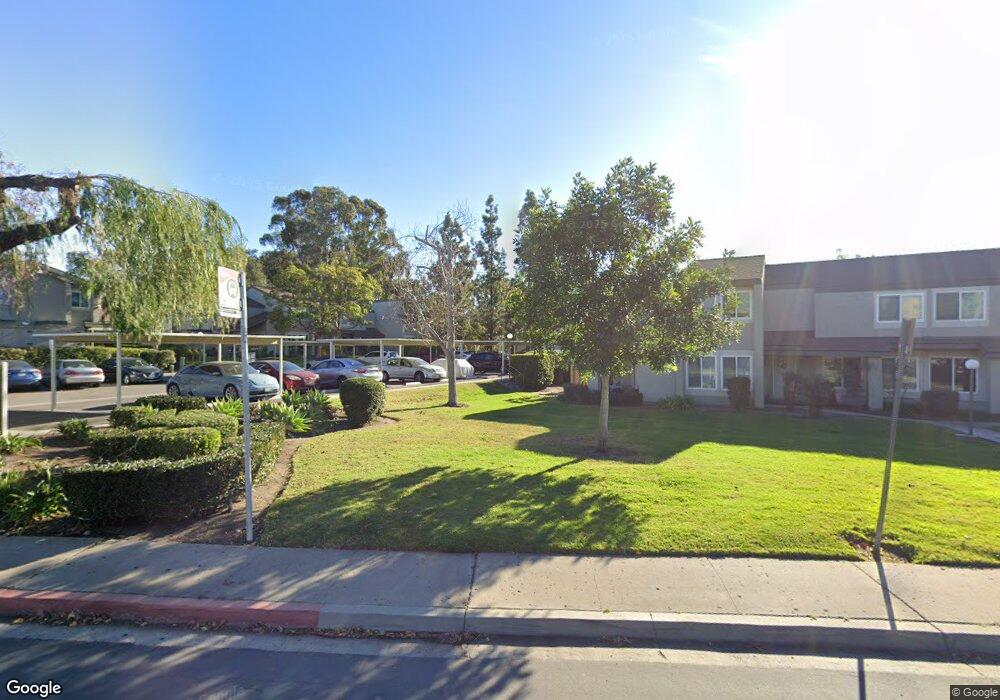
10866 Macouba Place San Diego, CA 92124
Tierrasanta NeighborhoodEstimated Value: $696,000 - $763,000
4
Beds
3
Baths
1,400
Sq Ft
$520/Sq Ft
Est. Value
About This Home
This home is located at 10866 Macouba Place, San Diego, CA 92124 and is currently estimated at $728,421, approximately $520 per square foot. 10866 Macouba Place is a home located in San Diego County with nearby schools including Tierrasanta Elementary, De Portola Middle School, and Farb Middle School.
Ownership History
Date
Name
Owned For
Owner Type
Purchase Details
Closed on
May 29, 2009
Sold by
Nefzi Adel and Rajhi Rim
Bought by
Montonen Rask Tarja T and Rask Michael C
Current Estimated Value
Home Financials for this Owner
Home Financials are based on the most recent Mortgage that was taken out on this home.
Original Mortgage
$214,000
Outstanding Balance
$135,354
Interest Rate
4.79%
Mortgage Type
Purchase Money Mortgage
Estimated Equity
$593,067
Purchase Details
Closed on
Aug 13, 2002
Sold by
Schoeman Hendrik S and Schoeman Marilyn J
Bought by
Nefzi Adel and Rajhi Rim
Home Financials for this Owner
Home Financials are based on the most recent Mortgage that was taken out on this home.
Original Mortgage
$255,600
Interest Rate
6.16%
Mortgage Type
Purchase Money Mortgage
Purchase Details
Closed on
Jan 16, 1996
Sold by
Schoeman Hendrik S and Schoeman Marilyn J
Bought by
Schoeman Hendrik S and Schoeman Marilyn J
Purchase Details
Closed on
Dec 22, 1993
Sold by
Martinique Holdings Inc
Bought by
Schoeman Hendrik S and Schoeman Marilyn J
Purchase Details
Closed on
Jun 19, 1986
Create a Home Valuation Report for This Property
The Home Valuation Report is an in-depth analysis detailing your home's value as well as a comparison with similar homes in the area
Home Values in the Area
Average Home Value in this Area
Purchase History
| Date | Buyer | Sale Price | Title Company |
|---|---|---|---|
| Montonen Rask Tarja T | $324,000 | Equity Title San Diego | |
| Nefzi Adel | $319,500 | Equity Title Company | |
| Schoeman Hendrik S | -- | -- | |
| Schoeman Hendrik S | $152,500 | First American Title | |
| -- | $93,500 | -- |
Source: Public Records
Mortgage History
| Date | Status | Borrower | Loan Amount |
|---|---|---|---|
| Open | Montonen Rask Tarja T | $214,000 | |
| Previous Owner | Nefzi Adel | $255,600 | |
| Closed | Nefzi Adel | $31,950 |
Source: Public Records
Tax History Compared to Growth
Tax History
| Year | Tax Paid | Tax Assessment Tax Assessment Total Assessment is a certain percentage of the fair market value that is determined by local assessors to be the total taxable value of land and additions on the property. | Land | Improvement |
|---|---|---|---|---|
| 2025 | $5,137 | $418,208 | $271,062 | $147,146 |
| 2024 | $5,137 | $410,009 | $265,748 | $144,261 |
| 2023 | $5,022 | $401,971 | $260,538 | $141,433 |
| 2022 | $4,886 | $394,090 | $255,430 | $138,660 |
| 2021 | $4,850 | $386,364 | $250,422 | $135,942 |
| 2020 | $4,791 | $382,404 | $247,855 | $134,549 |
| 2019 | $4,706 | $374,907 | $242,996 | $131,911 |
| 2018 | $4,402 | $367,557 | $238,232 | $129,325 |
| 2017 | $80 | $360,351 | $233,561 | $126,790 |
| 2016 | $4,229 | $353,286 | $228,982 | $124,304 |
| 2015 | $4,166 | $347,980 | $225,543 | $122,437 |
| 2014 | $4,101 | $341,164 | $221,125 | $120,039 |
Source: Public Records
Map
Nearby Homes
- 5059 La Cuenta Dr
- 5137 Abuela Dr
- 10834 Caravelle Place
- 10852 Carbet Place
- 10889 Lamentin Ct
- 10812 Lamentin Ct Unit 312
- 10748 Escobar Dr
- 10828 Lamentin Ct Unit 313
- 10945 Clairemont Mesa Blvd
- 10706 Esmeraldas Dr Unit 6
- 10690 Esmeraldas Dr
- 10853 Valldemosa Ln
- 10617 Escobar Dr Unit 4
- 4375 Calle de Vida
- 10966 Baroque Ln
- 10976 Pallon Way
- 11037 Pallon Way
- 3975 Catamarca Dr
- 6140 Calle Mariselda Unit 102
- 10908 Avenida Playa Veracruz
- 10890 Macouba Place
- 5115 La Cuenta Dr Unit 198
- 10816 Macouba Place Unit 171
- 10830 Macouba Place
- 10834 Macouba Place
- 10836 Macouba Place Unit 165
- 10838 Macouba Place
- 10864 Macouba Place
- 5077 La Cuenta Dr Unit 186
- 5097 La Cuenta Dr Unit 181
- 5075 La Cuenta Dr
- 10868 Macouba Place Unit 157
- 10860 Macouba Place
- 10856 Macouba Place
- 10886 Macouba Place Unit 145
- 5113 La Cuenta Dr Unit 199
- 5117 La Cuenta Dr Unit 197
- 5107 La Cuenta Dr
- 10818 Macouba Place
- 10820 Macouba Place