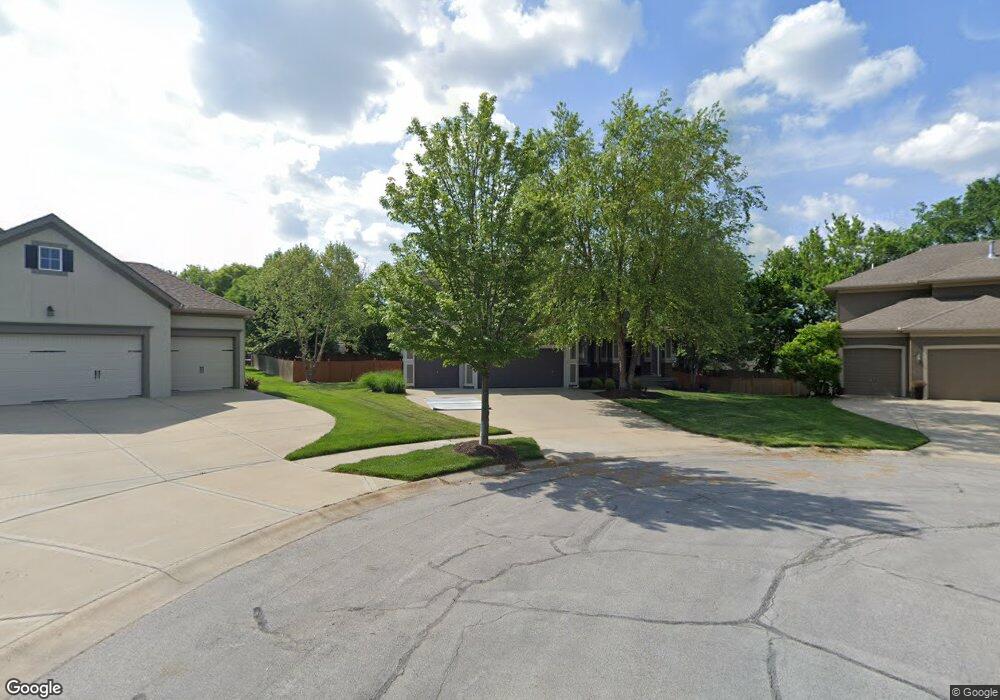
10869 S Deer Run St Olathe, KS 66061
Estimated Value: $618,000 - $699,000
4
Beds
4
Baths
3,243
Sq Ft
$204/Sq Ft
Est. Value
About This Home
This home is located at 10869 S Deer Run St, Olathe, KS 66061 and is currently estimated at $660,749, approximately $203 per square foot. 10869 S Deer Run St is a home located in Johnson County with nearby schools including Meadow Lane Elementary School, Prairie Trail Middle School, and Olathe Northwest High School.
Ownership History
Date
Name
Owned For
Owner Type
Purchase Details
Closed on
Mar 23, 2021
Sold by
Woodworth Zell W and Mitchell Bradley L
Bought by
Woodworth Zell W and Mitchell Bradley L
Current Estimated Value
Purchase Details
Closed on
Sep 20, 2007
Sold by
Stonewood Builders Llc
Bought by
Mitchell Bradley L and Woodworth Zell W
Home Financials for this Owner
Home Financials are based on the most recent Mortgage that was taken out on this home.
Original Mortgage
$294,400
Outstanding Balance
$186,203
Interest Rate
6.55%
Mortgage Type
New Conventional
Estimated Equity
$474,546
Purchase Details
Closed on
Feb 14, 2006
Sold by
Bell Development Inc
Bought by
Stonewood Builders Llc
Home Financials for this Owner
Home Financials are based on the most recent Mortgage that was taken out on this home.
Original Mortgage
$344,500
Interest Rate
6.05%
Mortgage Type
Construction
Create a Home Valuation Report for This Property
The Home Valuation Report is an in-depth analysis detailing your home's value as well as a comparison with similar homes in the area
Home Values in the Area
Average Home Value in this Area
Purchase History
| Date | Buyer | Sale Price | Title Company |
|---|---|---|---|
| Woodworth Zell W | -- | None Available | |
| Mitchell Bradley L | -- | First American Title Ins Co | |
| Stonewood Builders Llc | -- | Homestead Title |
Source: Public Records
Mortgage History
| Date | Status | Borrower | Loan Amount |
|---|---|---|---|
| Open | Mitchell Bradley L | $294,400 | |
| Previous Owner | Stonewood Builders Llc | $344,500 |
Source: Public Records
Tax History Compared to Growth
Tax History
| Year | Tax Paid | Tax Assessment Tax Assessment Total Assessment is a certain percentage of the fair market value that is determined by local assessors to be the total taxable value of land and additions on the property. | Land | Improvement |
|---|---|---|---|---|
| 2024 | $7,337 | $64,492 | $12,412 | $52,080 |
| 2023 | $7,159 | $62,008 | $12,412 | $49,596 |
| 2022 | $6,349 | $53,533 | $10,787 | $42,746 |
| 2021 | $6,083 | $49,025 | $10,787 | $38,238 |
| 2020 | $6,336 | $50,589 | $10,787 | $39,802 |
| 2019 | $6,203 | $49,197 | $9,379 | $39,818 |
| 2018 | $6,683 | $52,589 | $9,379 | $43,210 |
| 2017 | $6,661 | $51,865 | $9,379 | $42,486 |
| 2016 | $6,060 | $48,404 | $7,973 | $40,431 |
| 2015 | $6,010 | $44,447 | $7,975 | $36,472 |
| 2013 | -- | $42,044 | $8,462 | $33,582 |
Source: Public Records
Map
Nearby Homes
- 0 College Blvd Unit HMS2548994
- 10744 S Palisade St
- 21430 W 112th Terrace
- 9915 Brockway St
- 20695 W 110th St
- 11038 Palisade St
- 11017 S Palisade St
- Westwood Plan at Cedar Ridge Reserve - Cedar Ridge
- Truman Plan at Cedar Ridge Reserve - Cedar Ridge
- Roosevelt Ex Plan at Cedar Ridge Reserve - Cedar Ridge
- Roosevelt SE Plan at Cedar Ridge Reserve - Cedar Ridge
- Roosevelt Plan at Cedar Ridge Reserve - Cedar Ridge
- Roosevelt Ranch SE Plan at Cedar Ridge Reserve - Cedar Ridge
- Riviera Plan at Cedar Ridge Reserve - Cedar Ridge
- Oakmont Plan at Cedar Ridge Reserve - Cedar Ridge
- Madison II Plan at Cedar Ridge Reserve - Cedar Ridge
- Kingston Plan at Cedar Ridge Reserve - Cedar Ridge
- Jefferson IV Plan at Cedar Ridge Reserve - Cedar Ridge
- Jefferson III Plan at Cedar Ridge Reserve - Cedar Ridge
- Jefferson II Plan at Cedar Ridge Reserve - Cedar Ridge
- 10849 S Deer Run St
- 10870 S Deer Run St
- 10848 S Brownridge St
- 10829 S Deer Run St
- 10868 S Brownridge St
- 10850 S Deer Run St
- 10830 S Deer Run St
- 10828 S Brownridge St
- 10809 S Deer Run St
- 10810 S Deer Run St
- 10808 S Brownridge St
- 10867 S Brownridge St
- 10847 S Brownridge St
- 10827 S Brownridge St
- 10791 S Deer Run St
- 10790 S Brownridge St
- 10807 S Brownridge St
- 21169 W 108th Terrace
- 10792 S Deer Run St
- 21181 W 108th Terrace