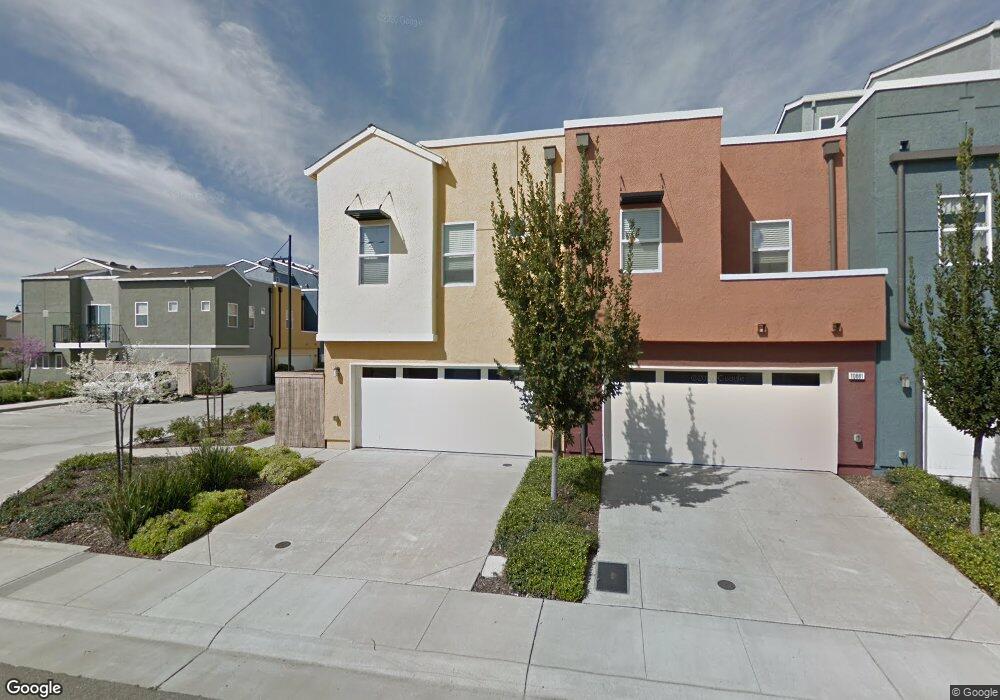
10879 Stourport Way Rancho Cordova, CA 95670
Capital Village NeighborhoodEstimated Value: $233,000 - $447,000
3
Beds
2
Baths
1,311
Sq Ft
$292/Sq Ft
Est. Value
About This Home
This home is located at 10879 Stourport Way, Rancho Cordova, CA 95670 and is currently estimated at $382,989, approximately $292 per square foot. 10879 Stourport Way is a home located in Sacramento County with nearby schools including Navigator Elementary School, W.E. Mitchell Middle School, and Cordova High School.
Ownership History
Date
Name
Owned For
Owner Type
Purchase Details
Closed on
Nov 1, 2011
Sold by
Kim Hong D
Bought by
Cramer Heather M
Current Estimated Value
Home Financials for this Owner
Home Financials are based on the most recent Mortgage that was taken out on this home.
Original Mortgage
$143,273
Outstanding Balance
$96,416
Interest Rate
3.75%
Mortgage Type
FHA
Estimated Equity
$286,573
Purchase Details
Closed on
Apr 12, 2011
Sold by
Wiest Robert J and Wiest Su E
Bought by
Kim Hong D
Purchase Details
Closed on
Aug 20, 2010
Sold by
Kim Hong D
Bought by
Wiest Robert J and Wiest Su E
Purchase Details
Closed on
Oct 23, 2008
Sold by
Kim Ok Ja
Bought by
Kim Hong
Purchase Details
Closed on
Aug 5, 2008
Sold by
Beazer Homes Holdings Corp
Bought by
Kim Hong
Home Financials for this Owner
Home Financials are based on the most recent Mortgage that was taken out on this home.
Original Mortgage
$164,193
Interest Rate
5.77%
Mortgage Type
FHA
Create a Home Valuation Report for This Property
The Home Valuation Report is an in-depth analysis detailing your home's value as well as a comparison with similar homes in the area
Home Values in the Area
Average Home Value in this Area
Purchase History
| Date | Buyer | Sale Price | Title Company |
|---|---|---|---|
| Cramer Heather M | $147,000 | Placer Title Company | |
| Kim Hong D | -- | Placer Title Company | |
| Kim Hong D | -- | None Available | |
| Wiest Robert J | -- | None Available | |
| Kim Hong | -- | Chicago Title Company | |
| Kim Hong | $219,000 | Chicago Title Company |
Source: Public Records
Mortgage History
| Date | Status | Borrower | Loan Amount |
|---|---|---|---|
| Open | Kim Hong D | $143,273 | |
| Previous Owner | Kim Hong | $164,193 |
Source: Public Records
Tax History Compared to Growth
Tax History
| Year | Tax Paid | Tax Assessment Tax Assessment Total Assessment is a certain percentage of the fair market value that is determined by local assessors to be the total taxable value of land and additions on the property. | Land | Improvement |
|---|---|---|---|---|
| 2025 | $3,410 | $184,626 | $100,478 | $84,148 |
| 2024 | $3,410 | $181,007 | $98,508 | $82,499 |
| 2023 | $3,301 | $177,459 | $96,577 | $80,882 |
| 2022 | $3,208 | $173,981 | $94,684 | $79,297 |
| 2021 | $3,131 | $170,571 | $92,828 | $77,743 |
| 2020 | $3,093 | $168,823 | $91,877 | $76,946 |
| 2019 | $3,034 | $165,514 | $90,076 | $75,438 |
| 2018 | $2,952 | $162,269 | $88,310 | $73,959 |
| 2017 | $2,866 | $159,088 | $86,579 | $72,509 |
| 2016 | $2,810 | $155,970 | $84,882 | $71,088 |
| 2015 | $2,700 | $153,628 | $83,607 | $70,021 |
| 2014 | $2,797 | $150,620 | $81,970 | $68,650 |
Source: Public Records
Map
Nearby Homes
- 10884 Stourport Way
- 11021 International Dr
- 10854 Atherstone Dr
- 3215 Bridgeway Dr
- 3216 Bridgeway Dr
- 10851 Arrington Dr
- 11076 International Dr
- 3316 Corvina Dr
- 3247 Foxton Way
- 10969 Pelara Way
- 10884 Windrow Way
- 3412 Muscat Way
- 10880 Windrow Way
- 10907 Bushel Way
- 2724 Zinfandel Dr
- 10916 Bushel Way
- 10929 Bushel Way
- 10927 Bushel Way
- 3470 Russet Way
- 3467 Barley Way
- 10883 Stourport Way
- 10885 Stourport Way
- 10887 Stourport Way
- 10838 Nederland Way
- 10840 Nederland Way
- 10842 Nederland Way
- 3168 Bridgeway Dr
- 10844 Nederland Way
- 10889 Stourport Way
- 10880 Stourport Way
- 10882 Stourport Way
- 10848 Nederland Way
- 10846 Nederland Way
- 3166 Bridgeway Dr
- 3164 Bridgeway Dr
- 3178 Bridgeway Dr
- 3180 Bridgeway Dr
- 10886 Stourport Way
- 3160 Bridgeway Dr