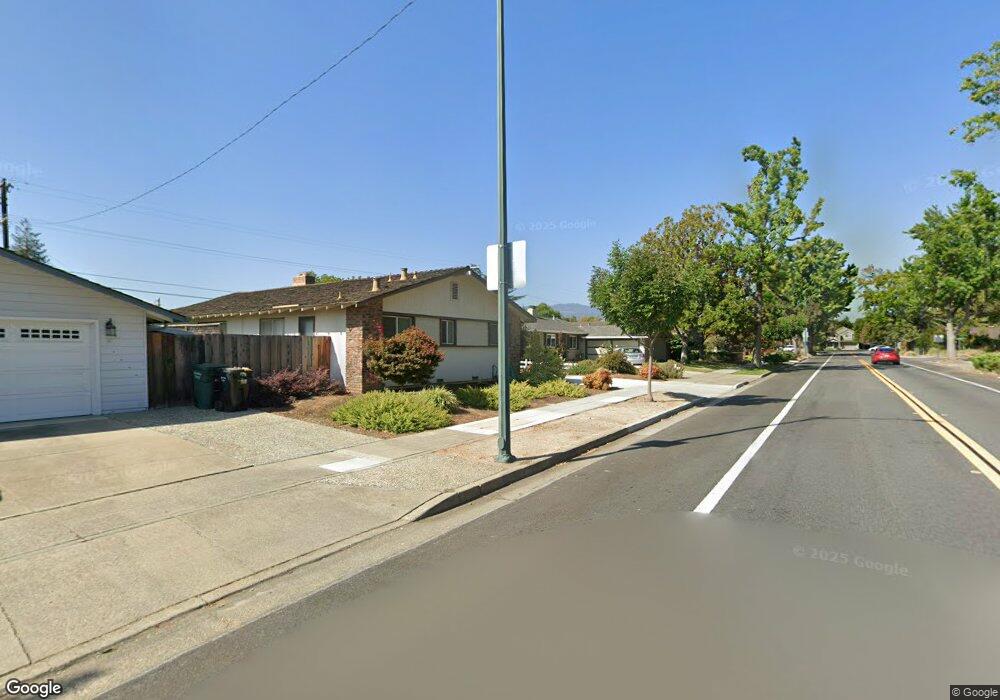
1088 Ticonderoga Dr Sunnyvale, CA 94087
Estimated Value: $3,020,949 - $3,212,000
4
Beds
2
Baths
1,289
Sq Ft
$2,422/Sq Ft
Est. Value
About This Home
This home is located at 1088 Ticonderoga Dr, Sunnyvale, CA 94087 and is currently estimated at $3,121,737, approximately $2,421 per square foot. 1088 Ticonderoga Dr is a home located in Santa Clara County with nearby schools including Cherry Chase Elementary School, Sunnyvale Middle School, and Homestead High School.
Ownership History
Date
Name
Owned For
Owner Type
Purchase Details
Closed on
Apr 14, 2004
Sold by
Amacher Wayne E and Amacher Jean M
Bought by
Amacher Wayne E and Amacher Jean M
Current Estimated Value
Home Financials for this Owner
Home Financials are based on the most recent Mortgage that was taken out on this home.
Original Mortgage
$259,300
Interest Rate
5.57%
Mortgage Type
New Conventional
Purchase Details
Closed on
Jan 31, 2003
Sold by
Amacher Wayne E and Amacher Jean M
Bought by
Amacher Wayne E and Amacher Jean M
Home Financials for this Owner
Home Financials are based on the most recent Mortgage that was taken out on this home.
Original Mortgage
$275,000
Interest Rate
5.83%
Purchase Details
Closed on
Oct 19, 1999
Sold by
Amacher Wayne E and Amacher Jean M
Bought by
Amacher Wayne E and Amacher Jean M
Create a Home Valuation Report for This Property
The Home Valuation Report is an in-depth analysis detailing your home's value as well as a comparison with similar homes in the area
Home Values in the Area
Average Home Value in this Area
Purchase History
| Date | Buyer | Sale Price | Title Company |
|---|---|---|---|
| Amacher Wayne E | -- | Fidelity National Title Ins | |
| Amacher Wayne E | -- | Financial Title Company | |
| Amacher Wayne E | -- | Financial Title Company | |
| Amacher Wayne E | -- | -- | |
| Amacher Wayne E | -- | -- |
Source: Public Records
Mortgage History
| Date | Status | Borrower | Loan Amount |
|---|---|---|---|
| Closed | Amacher Wayne E | $259,300 | |
| Closed | Amacher Wayne E | $275,000 |
Source: Public Records
Tax History Compared to Growth
Tax History
| Year | Tax Paid | Tax Assessment Tax Assessment Total Assessment is a certain percentage of the fair market value that is determined by local assessors to be the total taxable value of land and additions on the property. | Land | Improvement |
|---|---|---|---|---|
| 2025 | $1,828 | $145,236 | $33,233 | $112,003 |
| 2024 | $1,828 | $142,389 | $32,582 | $109,807 |
| 2023 | $1,810 | $139,598 | $31,944 | $107,654 |
| 2022 | $1,787 | $136,862 | $31,318 | $105,544 |
| 2021 | $1,768 | $134,179 | $30,704 | $103,475 |
| 2020 | $1,745 | $132,804 | $30,390 | $102,414 |
| 2019 | $1,711 | $130,201 | $29,795 | $100,406 |
| 2018 | $1,678 | $127,649 | $29,211 | $98,438 |
| 2017 | $1,656 | $125,147 | $28,639 | $96,508 |
| 2016 | $1,587 | $122,694 | $28,078 | $94,616 |
| 2015 | $1,592 | $120,852 | $27,657 | $93,195 |
| 2014 | $1,563 | $118,486 | $27,116 | $91,370 |
Source: Public Records
Map
Nearby Homes
- 1244 Elderberry Dr
- 1072 Syracuse Dr
- 1402 Bedford Ave
- 1624 Clay Dr
- 1507 Dominion Ave
- 1684 Newcastle Dr
- 1686 Parkhills Ave
- 1523 Ashcroft Way
- 1881 Alford Ave
- 1901 Alford Ave
- 1262 Riesling Terrace
- 1296 Riesling Terrace
- 2721 Fairbrook Dr
- 960 Heatherstone Ave
- 1201 Heatherstone Way
- 1402 Oak Ave
- 857 Peach Ave
- 1315 Bright Oaks Ct
- 654 Princeton Dr
- 1014 W Homestead Rd
- 1090 Ticonderoga Dr
- 1086 Ticonderoga Dr
- 1091 Valley Forge Dr
- 1089 Valley Forge Dr
- 1092 Ticonderoga Dr
- 1084 Ticonderoga Dr
- 1093 Valley Forge Dr
- 1089 Ticonderoga Dr
- 1087 Valley Forge Dr
- 1091 Ticonderoga Dr
- 1087 Ticonderoga Dr
- 1094 Ticonderoga Dr
- 1082 Ticonderoga Dr
- 1085 Valley Forge Dr
- 1095 Valley Forge Dr
- 1085 Ticonderoga Dr
- 1258 Cranberry Ave
- 1090 Valley Forge Dr
- 1088 Valley Forge Dr
- 1096 Ticonderoga Dr