10880 Sabre Hill Dr Unit 300 San Diego, CA 92128
Sabre Springs NeighborhoodEstimated Value: $567,000 - $628,000
2
Beds
2
Baths
904
Sq Ft
$671/Sq Ft
Est. Value
About This Home
This home is located at 10880 Sabre Hill Dr Unit 300, San Diego, CA 92128 and is currently estimated at $606,389, approximately $670 per square foot. 10880 Sabre Hill Dr Unit 300 is a home located in San Diego County with nearby schools including Morning Creek Elementary School, Meadowbrook Middle, and Mt. Carmel High School.
Ownership History
Date
Name
Owned For
Owner Type
Purchase Details
Closed on
Dec 31, 2012
Sold by
Laschinski Mark and Laschinski Kurt W
Bought by
Laschinski Mark
Current Estimated Value
Home Financials for this Owner
Home Financials are based on the most recent Mortgage that was taken out on this home.
Original Mortgage
$155,800
Outstanding Balance
$75,446
Interest Rate
3.29%
Mortgage Type
New Conventional
Estimated Equity
$567,319
Purchase Details
Closed on
Jun 25, 2003
Sold by
Hodar Carlos and Dehodar Josefina M
Bought by
Laschinski Mark and Laschinski Kurt W
Home Financials for this Owner
Home Financials are based on the most recent Mortgage that was taken out on this home.
Original Mortgage
$182,000
Interest Rate
5.18%
Mortgage Type
Purchase Money Mortgage
Purchase Details
Closed on
Jul 23, 1993
Create a Home Valuation Report for This Property
The Home Valuation Report is an in-depth analysis detailing your home's value as well as a comparison with similar homes in the area
Home Values in the Area
Average Home Value in this Area
Purchase History
| Date | Buyer | Sale Price | Title Company |
|---|---|---|---|
| Laschinski Mark | -- | None Available | |
| Laschinski Mark | $262,000 | California Title Company | |
| -- | $114,900 | -- |
Source: Public Records
Mortgage History
| Date | Status | Borrower | Loan Amount |
|---|---|---|---|
| Open | Laschinski Mark | $155,800 | |
| Closed | Laschinski Mark | $182,000 | |
| Previous Owner | Dehodar Josefina M | $65,800 | |
| Previous Owner | Hodar Carlos | $35,000 |
Source: Public Records
Tax History Compared to Growth
Tax History
| Year | Tax Paid | Tax Assessment Tax Assessment Total Assessment is a certain percentage of the fair market value that is determined by local assessors to be the total taxable value of land and additions on the property. | Land | Improvement |
|---|---|---|---|---|
| 2024 | $3,932 | $365,184 | $170,047 | $195,137 |
| 2023 | $3,847 | $358,024 | $166,713 | $191,311 |
| 2022 | $3,789 | $351,005 | $163,445 | $187,560 |
| 2021 | $3,719 | $344,124 | $160,241 | $183,883 |
| 2020 | $3,605 | $340,596 | $158,598 | $181,998 |
| 2019 | $3,510 | $333,919 | $155,489 | $178,430 |
| 2018 | $3,412 | $327,373 | $152,441 | $174,932 |
| 2017 | $3,227 | $310,000 | $140,000 | $170,000 |
| 2016 | $3,067 | $295,000 | $134,000 | $161,000 |
| 2015 | $3,461 | $290,000 | $132,000 | $158,000 |
| 2014 | $3,372 | $280,000 | $128,000 | $152,000 |
Source: Public Records
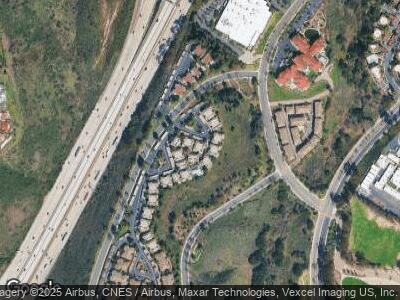
Map
Nearby Homes
- 10820 Sabre Hill Dr Unit 185
- 10810 Sabre Hill Dr Unit 179
- 13063 Wimberly Square Unit 114
- 13206 Wimberly Square Unit 171
- 13106 Midbluff Ave
- 13227 Wimberly Square Unit 264
- 13259 Wimberly Square Unit 257
- 10202 Vista Lusardi Unit LOT 9
- 12655 Belle Fleur Way
- 10339 Azuaga St Unit 214
- 13260 Wimberly Square Unit 240
- 13306 Caminito Ciera Unit 190
- 13272 Wimberly Square Unit 219
- 13193 Avenida Del General
- 12737 Savannah Creek Dr Unit 280
- 13334 Caminito Ciera Unit 30
- 12697 Savannah Creek Dr Unit 267
- 10347 Azuaga St Unit 87
- 10954 Cool Lake Terrace
- 10005 Paseo Montril
- 10880 Sabre Hill Dr Unit 301
- 10868 Sabre Hill Dr Unit 272
- 10868 Sabre Hill Dr Unit 271
- 10868 Sabre Hill Dr Unit 265
- 10880 Sabre Hill Dr Unit 303
- 10880 Sabre Hill Dr Unit 302
- 10880 Sabre Hill Dr Unit 300
- 10880 Sabre Hill Dr Unit 299
- 10880 Sabre Hill Dr Unit 298
- 10880 Sabre Hill Dr Unit 297
- 10878 Sabre Hill Dr Unit 296
- 10878 Sabre Hill Dr Unit 295
- 10878 Sabre Hill Dr Unit 294
- 10878 Sabre Hill Dr Unit 293
- 10878 Sabre Hill Dr Unit 292
- 10878 Sabre Hill Dr Unit 291
- 10878 Sabre Hill Dr Unit 290
- 10870 Sabre Hill Dr Unit 273
- 10868 Sabre Hill Dr Unit 269
- 10868 Sabre Hill Dr Unit 268