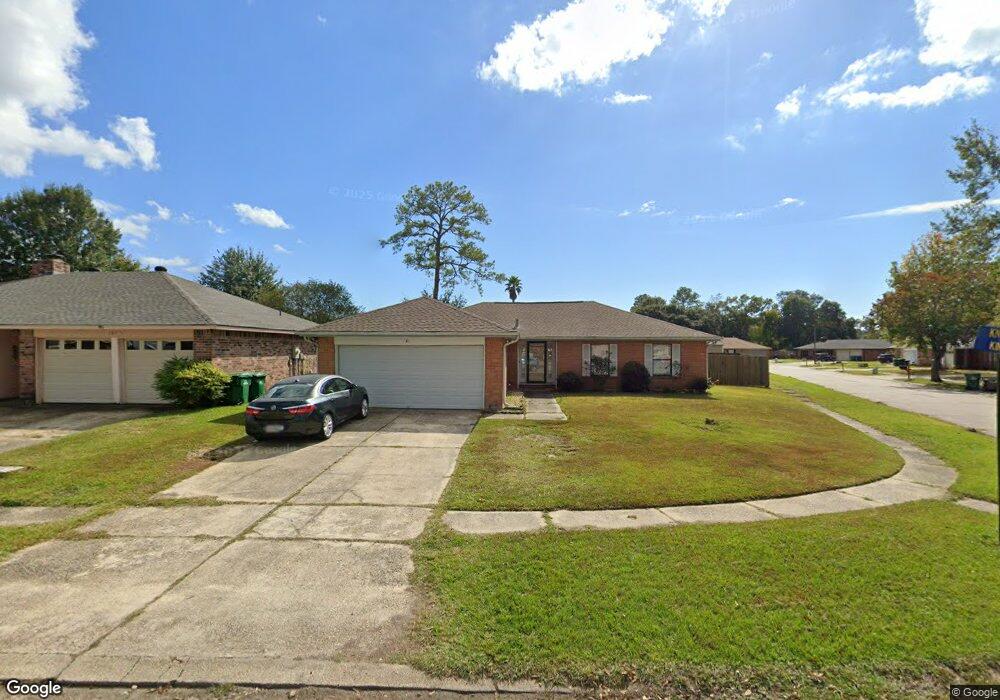
109 Knights Dr Slidell, LA 70458
Estimated Value: $175,000 - $200,000
4
Beds
2
Baths
1,783
Sq Ft
$104/Sq Ft
Est. Value
About This Home
This home is located at 109 Knights Dr, Slidell, LA 70458 and is currently estimated at $186,114, approximately $104 per square foot. 109 Knights Dr is a home located in St. Tammany Parish with nearby schools including Whispering Forest Elementary School, Clearwood Junior High School, and Northshore High School.
Ownership History
Date
Name
Owned For
Owner Type
Purchase Details
Closed on
Jun 22, 2021
Sold by
Phillips Bucky Minh
Bought by
Phillips Jennifer Loan
Current Estimated Value
Purchase Details
Closed on
Sep 10, 2010
Sold by
Schrieffer Jennifer D and Schrieffer Scott D
Bought by
Vo Phillips Loan T and Phillips Bucky M
Home Financials for this Owner
Home Financials are based on the most recent Mortgage that was taken out on this home.
Original Mortgage
$137,153
Outstanding Balance
$91,071
Interest Rate
4.55%
Mortgage Type
FHA
Estimated Equity
$95,043
Purchase Details
Closed on
Nov 13, 2009
Sold by
Puckett Jeffery Clarence and Puckett Pamela Inzina
Bought by
Schrieffer Scott D and Schrieffer Jennifer D Polk
Home Financials for this Owner
Home Financials are based on the most recent Mortgage that was taken out on this home.
Original Mortgage
$106,837
Interest Rate
4.93%
Mortgage Type
FHA
Create a Home Valuation Report for This Property
The Home Valuation Report is an in-depth analysis detailing your home's value as well as a comparison with similar homes in the area
Home Values in the Area
Average Home Value in this Area
Purchase History
| Date | Buyer | Sale Price | Title Company |
|---|---|---|---|
| Phillips Jennifer Loan | -- | None Available | |
| Vo Phillips Loan T | $139,000 | None Available | |
| Schrieffer Scott D | $135,000 | Title & Abstract Services In |
Source: Public Records
Mortgage History
| Date | Status | Borrower | Loan Amount |
|---|---|---|---|
| Open | Vo Phillips Loan T | $137,153 | |
| Previous Owner | Schrieffer Scott D | $106,837 |
Source: Public Records
Tax History Compared to Growth
Tax History
| Year | Tax Paid | Tax Assessment Tax Assessment Total Assessment is a certain percentage of the fair market value that is determined by local assessors to be the total taxable value of land and additions on the property. | Land | Improvement |
|---|---|---|---|---|
| 2024 | $850 | $13,959 | $1,928 | $12,031 |
| 2023 | $884 | $12,363 | $1,928 | $10,435 |
| 2022 | $72,856 | $12,363 | $1,928 | $10,435 |
| 2021 | $728 | $12,363 | $1,928 | $10,435 |
| 2020 | $609 | $11,548 | $1,800 | $9,748 |
| 2019 | $1,794 | $12,003 | $1,872 | $10,131 |
| 2018 | $1,800 | $12,003 | $1,872 | $10,131 |
| 2017 | $1,872 | $12,003 | $1,872 | $10,131 |
| 2016 | $1,915 | $12,003 | $1,872 | $10,131 |
| 2015 | $728 | $11,541 | $1,800 | $9,741 |
| 2014 | $716 | $11,541 | $1,800 | $9,741 |
| 2013 | -- | $11,541 | $1,800 | $9,741 |
Source: Public Records
Map
Nearby Homes