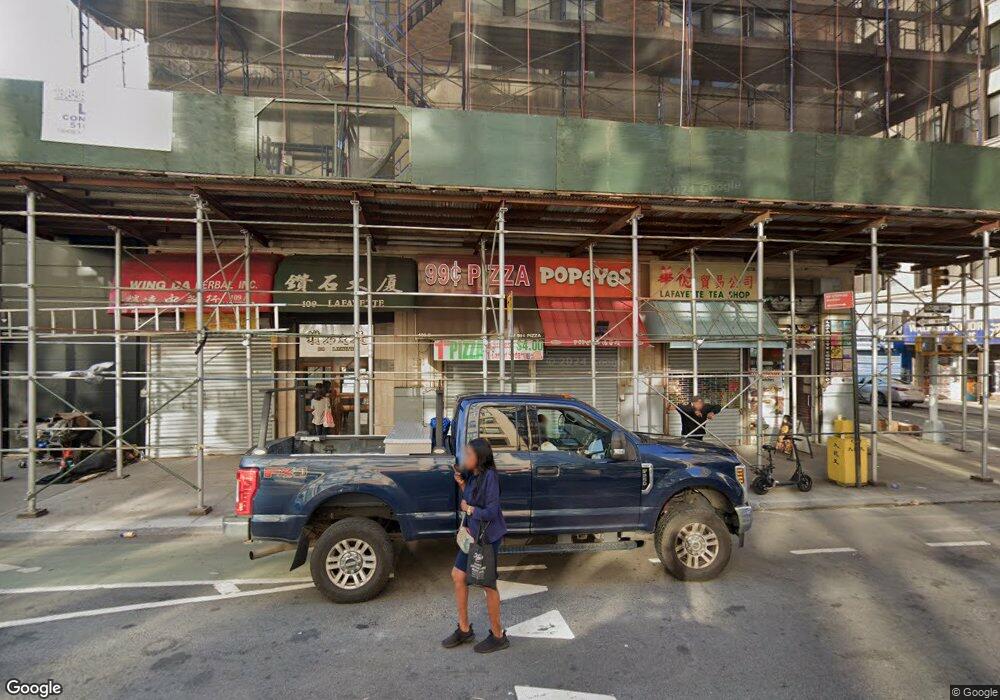
109 Lafayette St Unit C1 New York, NY 10013
Tribeca NeighborhoodEstimated Value: $1,172,041
--
Bed
--
Bath
3,370
Sq Ft
$348/Sq Ft
Est. Value
About This Home
This home is located at 109 Lafayette St Unit C1, New York, NY 10013 and is currently estimated at $1,172,041, approximately $347 per square foot. 109 Lafayette St Unit C1 is a home located in New York County with nearby schools including P.S. 124 Yung Wing Elementary, M.S. 131 Dr. Sun Yat Sen, and Lower Manhattan Community Middle School.
Ownership History
Date
Name
Owned For
Owner Type
Purchase Details
Closed on
Aug 11, 2017
Sold by
Zhang Hong
Bought by
Lu'S Consultant Associates Llc
Current Estimated Value
Home Financials for this Owner
Home Financials are based on the most recent Mortgage that was taken out on this home.
Original Mortgage
$565,000
Outstanding Balance
$471,449
Interest Rate
3.96%
Mortgage Type
Commercial
Estimated Equity
$700,592
Purchase Details
Closed on
Jun 28, 2002
Sold by
Chan Cindy and Chan Joseph
Bought by
Zhang Hong
Purchase Details
Closed on
Jul 15, 1999
Sold by
Chan Chi Yan and Ho Shun Chi
Bought by
Chan Joseph and Chan Cindy
Home Financials for this Owner
Home Financials are based on the most recent Mortgage that was taken out on this home.
Original Mortgage
$217,500
Interest Rate
7.71%
Mortgage Type
Commercial
Create a Home Valuation Report for This Property
The Home Valuation Report is an in-depth analysis detailing your home's value as well as a comparison with similar homes in the area
Home Values in the Area
Average Home Value in this Area
Purchase History
| Date | Buyer | Sale Price | Title Company |
|---|---|---|---|
| Lu'S Consultant Associates Llc | $1,130,000 | -- | |
| Lu'S Consultant Associates Llc | $1,130,000 | -- | |
| Zhang Hong | -- | -- | |
| Zhang Hong | -- | -- | |
| Chan Joseph | $290,000 | -- | |
| Chan Joseph | -- | -- |
Source: Public Records
Mortgage History
| Date | Status | Borrower | Loan Amount |
|---|---|---|---|
| Open | Lu'S Consultant Associates Llc | $565,000 | |
| Closed | Lu'S Consultant Associates Llc | $565,000 | |
| Previous Owner | Chan Joseph | $217,500 |
Source: Public Records
Tax History Compared to Growth
Tax History
| Year | Tax Paid | Tax Assessment Tax Assessment Total Assessment is a certain percentage of the fair market value that is determined by local assessors to be the total taxable value of land and additions on the property. | Land | Improvement |
|---|---|---|---|---|
| 2025 | $12,059 | $109,933 | $34,188 | $75,745 |
| 2024 | $12,059 | $113,850 | $34,188 | $79,662 |
| 2023 | $12,028 | $112,980 | $34,188 | $78,792 |
| 2022 | $11,260 | $104,699 | $34,188 | $70,511 |
| 2021 | $10,132 | $94,740 | $34,188 | $60,552 |
| 2020 | $13,930 | $139,531 | $34,188 | $105,343 |
| 2019 | $13,649 | $135,375 | $34,188 | $101,187 |
| 2018 | $13,528 | $127,437 | $34,188 | $93,249 |
| 2017 | $12,553 | $129,974 | $34,188 | $95,786 |
| 2016 | $11,726 | $128,684 | $34,188 | $94,496 |
| 2015 | $6,446 | $127,624 | $34,188 | $93,436 |
| 2014 | $6,446 | $120,115 | $34,187 | $85,928 |
Source: Public Records
Map
Nearby Homes
- 83 Walker St Unit 4
- 83 Walker St Unit 5
- 129 Lafayette St Unit 8C
- 274 Canal St
- 395 Broadway Unit 7E
- 395 Broadway Unit 4E
- 123 Baxter St Unit PHB
- 50 Franklin St Unit 7A
- 210 Canal St Unit 510
- 376 Broadway Unit 10G
- 376 Broadway Unit 18E
- 376 Broadway Unit 9D
- 376 Broadway Unit 17E
- 391 Broadway Unit C
- 67 Franklin St Unit 4A
- 67 Franklin St Unit 4B
- 61 Lispenard St Unit BUILDING
- 141 Grand St
- 55 Walker St Unit 4A
- 55 Walker St Unit PH
- 109 Lafayette St
- 109 Lafayette St Unit 101
- 109 Lafayette St Unit 206
- 109 Lafayette St Unit 600
- 109 Lafayette St Unit C4
- 109 Lafayette St Unit 805
- 109 Lafayette St Unit 502
- 109 Lafayette St Unit C2
- 109 Lafayette St Unit 201
- 109 Lafayette St Unit 703
- 109 Lafayette St Unit 205
- 109 Lafayette St Unit 204
- 109 Lafayette St Unit 901
- 109 Lafayette St Unit 202
- 109 Lafayette St Unit 702
- 109 Lafayette St Unit 203
- 109 Lafayette St Unit 304
- 109 Lafayette St Unit 301
- 109 Lafayette St Unit 400
- 109 Lafayette St Unit 302