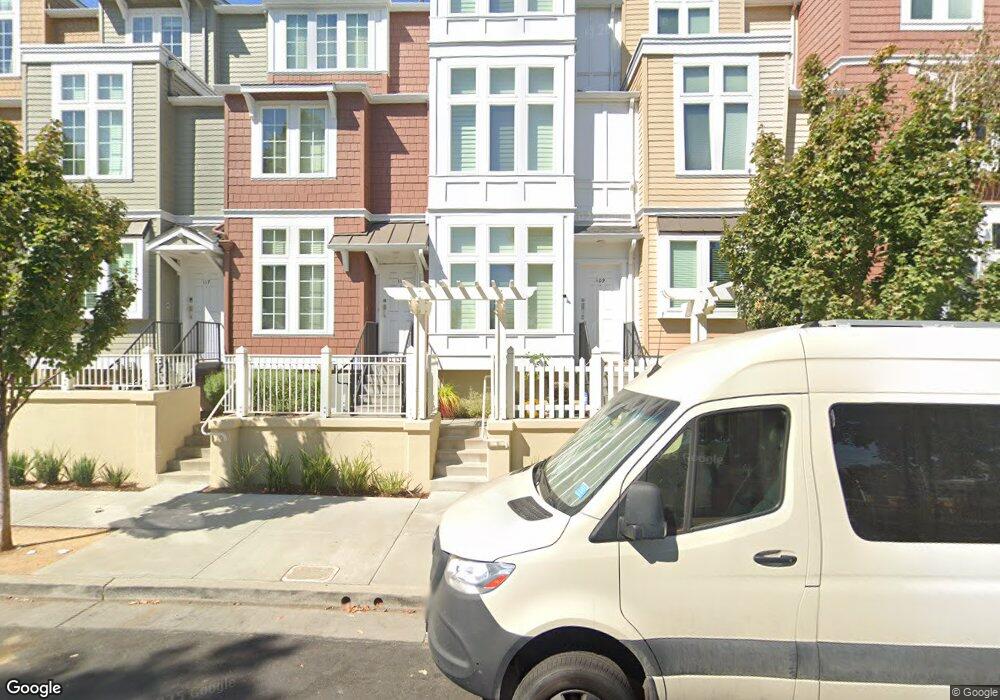
109 Laurel Grove Ln Unit U13 San Jose, CA 95126
Saint Leo's NeighborhoodEstimated Value: $964,000 - $1,204,000
4
Beds
3
Baths
1,650
Sq Ft
$655/Sq Ft
Est. Value
About This Home
This home is located at 109 Laurel Grove Ln Unit U13, San Jose, CA 95126 and is currently estimated at $1,081,108, approximately $655 per square foot. 109 Laurel Grove Ln Unit U13 is a home located in Santa Clara County with nearby schools including Merritt Trace Elementary, Herbert Hoover Middle School, and Abraham Lincoln High.
Ownership History
Date
Name
Owned For
Owner Type
Purchase Details
Closed on
Mar 10, 2005
Sold by
Lockett Rodney and Stoneley Margrit
Bought by
Burrows John W and Burrows Marianne W
Current Estimated Value
Home Financials for this Owner
Home Financials are based on the most recent Mortgage that was taken out on this home.
Original Mortgage
$492,000
Outstanding Balance
$249,596
Interest Rate
5.62%
Mortgage Type
New Conventional
Estimated Equity
$831,512
Purchase Details
Closed on
May 19, 2004
Sold by
Cahill South Llc
Bought by
Lockett Rodney and Stoneley Margrit
Home Financials for this Owner
Home Financials are based on the most recent Mortgage that was taken out on this home.
Original Mortgage
$410,400
Interest Rate
3.71%
Mortgage Type
Purchase Money Mortgage
Create a Home Valuation Report for This Property
The Home Valuation Report is an in-depth analysis detailing your home's value as well as a comparison with similar homes in the area
Home Values in the Area
Average Home Value in this Area
Purchase History
| Date | Buyer | Sale Price | Title Company |
|---|---|---|---|
| Burrows John W | $615,000 | Old Republic Title Company | |
| Lockett Rodney | -- | First American Title Company |
Source: Public Records
Mortgage History
| Date | Status | Borrower | Loan Amount |
|---|---|---|---|
| Open | Burrows John W | $492,000 | |
| Previous Owner | Lockett Rodney | $410,400 | |
| Closed | Lockett Rodney | $102,600 | |
| Closed | Burrows John W | $61,500 |
Source: Public Records
Tax History Compared to Growth
Tax History
| Year | Tax Paid | Tax Assessment Tax Assessment Total Assessment is a certain percentage of the fair market value that is determined by local assessors to be the total taxable value of land and additions on the property. | Land | Improvement |
|---|---|---|---|---|
| 2025 | $10,868 | $857,240 | $383,318 | $473,922 |
| 2024 | $10,868 | $840,432 | $375,802 | $464,630 |
| 2023 | $10,666 | $823,954 | $368,434 | $455,520 |
| 2022 | $10,573 | $807,799 | $361,210 | $446,589 |
| 2021 | $10,360 | $791,961 | $354,128 | $437,833 |
| 2020 | $10,114 | $783,841 | $350,497 | $433,344 |
| 2019 | $9,895 | $768,473 | $343,625 | $424,848 |
| 2018 | $9,797 | $753,406 | $336,888 | $416,518 |
| 2017 | $9,675 | $735,000 | $328,600 | $406,400 |
| 2016 | $8,998 | $679,000 | $303,600 | $375,400 |
| 2015 | $8,124 | $602,000 | $269,200 | $332,800 |
| 2014 | $6,962 | $536,000 | $239,700 | $296,300 |
Source: Public Records
Map
Nearby Homes
- 88 Bush St Unit 2173
- 218 Grayson Terrace
- 124 Sunol St Unit 303
- 953 Park Ave
- 311 Bautista Place
- 411 Park Ave Unit 333
- 411 Park Ave Unit 106
- 920 W Julian St
- 1183 Yosemite Ave
- 417 Stockton Ave
- 808 Lenzen Ave Unit 106
- 38 N Almaden Blvd Unit 1805
- 38 N Almaden Blvd Unit 1303
- 38 N Almaden Blvd Unit 506
- 38 N Almaden Blvd Unit 1413
- 38 N Almaden Blvd Unit 2001
- 38 N Almaden Blvd Unit 1220
- 502 Hannah St
- 652 Harrison Terrace Unit 12
- 715 Harrison St
- 105 Laurel Grove Ln
- 113 Laurel Grove Ln
- 117 Laurel Grove Ln
- 103 Laurel Grove Ln
- 121 Laurel Grove Ln
- 115 Cahill Park Dr
- 125 Laurel Grove Ln
- 107 Cahill Park Dr
- 111 Cahill Park Dr
- 119 Cahill Park Dr
- 101 Laurel Grove Ln
- 123 Cahill Park Dr
- 129 Laurel Grove Ln Unit U18
- 127 Cahill Park Dr
- 133 Laurel Grove Ln
- 131 Cahill Park Dr Unit U8
- 137 Laurel Grove Ln
- 137 Laurel Grove Ln
- 135 Cahill Park Dr Unit U9
- 139 Cahill Park Dr