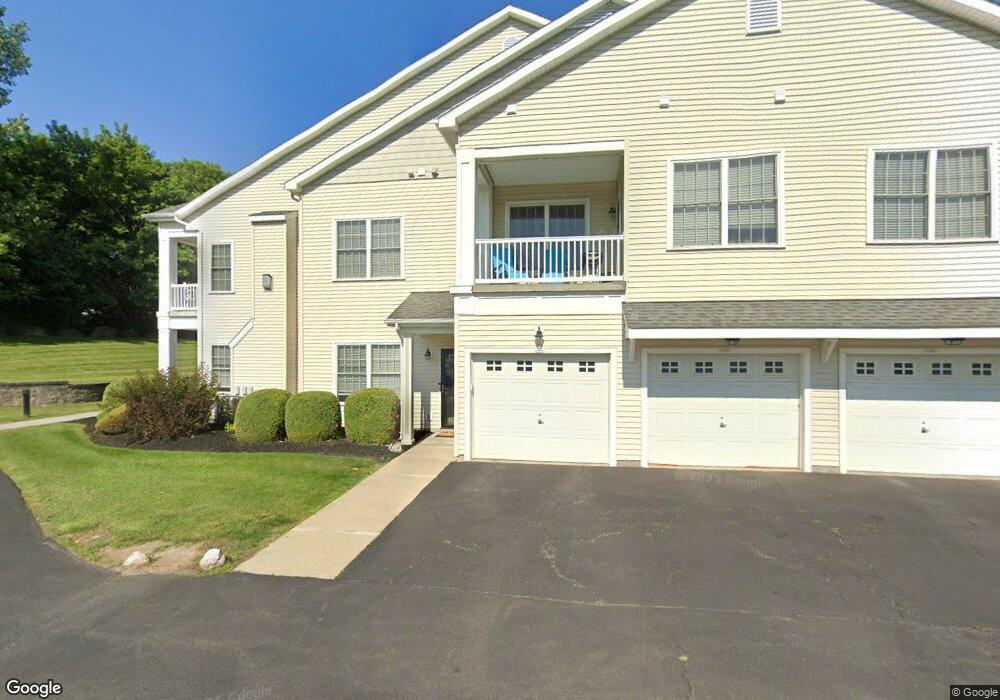
109 N Ridge Estate Troy, NY 12182
Lansingburgh NeighborhoodEstimated Value: $206,000 - $272,000
2
Beds
2
Baths
1,423
Sq Ft
$177/Sq Ft
Est. Value
About This Home
This home is located at 109 N Ridge Estate, Troy, NY 12182 and is currently estimated at $251,274, approximately $176 per square foot. 109 N Ridge Estate is a home located in Rensselaer County with nearby schools including Turnpike Elementary School, Rensselaer Park Elementary School, and Knickerbacker Middle School.
Ownership History
Date
Name
Owned For
Owner Type
Purchase Details
Closed on
Jan 6, 2022
Sold by
Johnson Yvonne
Bought by
Polcare Aaron
Current Estimated Value
Home Financials for this Owner
Home Financials are based on the most recent Mortgage that was taken out on this home.
Original Mortgage
$132,000
Outstanding Balance
$122,338
Interest Rate
3.55%
Mortgage Type
Purchase Money Mortgage
Estimated Equity
$128,936
Purchase Details
Closed on
Jun 5, 2015
Sold by
Brustman Barbara
Bought by
Johnsob Yvonne
Home Financials for this Owner
Home Financials are based on the most recent Mortgage that was taken out on this home.
Original Mortgage
$126,000
Interest Rate
3.65%
Mortgage Type
Purchase Money Mortgage
Purchase Details
Closed on
Jun 15, 2005
Sold by
Fmw Builders Llc
Bought by
Brustman Barbara A
Home Financials for this Owner
Home Financials are based on the most recent Mortgage that was taken out on this home.
Original Mortgage
$85,000
Interest Rate
5.78%
Mortgage Type
Purchase Money Mortgage
Create a Home Valuation Report for This Property
The Home Valuation Report is an in-depth analysis detailing your home's value as well as a comparison with similar homes in the area
Home Values in the Area
Average Home Value in this Area
Purchase History
| Date | Buyer | Sale Price | Title Company |
|---|---|---|---|
| Polcare Aaron | $148,000 | None Available | |
| Johnsob Yvonne | $140,000 | Brown & Brown | |
| Brustman Barbara A | $155,013 | James Blendell |
Source: Public Records
Mortgage History
| Date | Status | Borrower | Loan Amount |
|---|---|---|---|
| Open | Polcare Aaron | $132,000 | |
| Previous Owner | Johnsob Yvonne | $126,000 | |
| Previous Owner | Brustman Barbara A | $85,000 |
Source: Public Records
Tax History Compared to Growth
Tax History
| Year | Tax Paid | Tax Assessment Tax Assessment Total Assessment is a certain percentage of the fair market value that is determined by local assessors to be the total taxable value of land and additions on the property. | Land | Improvement |
|---|---|---|---|---|
| 2024 | $5,236 | $108,700 | $10,600 | $98,100 |
| 2023 | $4,870 | $108,700 | $10,600 | $98,100 |
| 2022 | $4,740 | $108,700 | $10,600 | $98,100 |
| 2021 | $1,238 | $108,700 | $10,600 | $98,100 |
| 2020 | $2,240 | $108,700 | $10,600 | $98,100 |
| 2019 | $3,372 | $108,700 | $10,600 | $98,100 |
| 2018 | $3,372 | $108,700 | $10,600 | $98,100 |
| 2017 | $3,329 | $108,700 | $10,600 | $98,100 |
| 2016 | $4,499 | $108,700 | $10,600 | $98,100 |
| 2015 | -- | $108,700 | $10,600 | $98,100 |
| 2014 | -- | $108,700 | $10,600 | $98,100 |
Source: Public Records
Map
Nearby Homes
- 108 N Ridge Estate
- 108 N Ridge Estate
- 111 N Ridge Estate
- 111 N Ridge Estates
- 107 N Ridge Estate
- 105 N Ridge Estate
- 110 N Ridge Estate
- 112 N Ridge Estate
- 104 N Ridge Estate
- 106 N Ridge Estate
- 102 N Ridge Estate
- 102 N Ridge Estates
- 103 N Ridge Estate
- 103 N Ridge Estates
- 101 N Ridge Estate
- 106 N Ridge Estates
- 205 N Ridge Estates
- 310 N Ridge Estate
- 310 N Ridge Estates
- 310 North Ridge