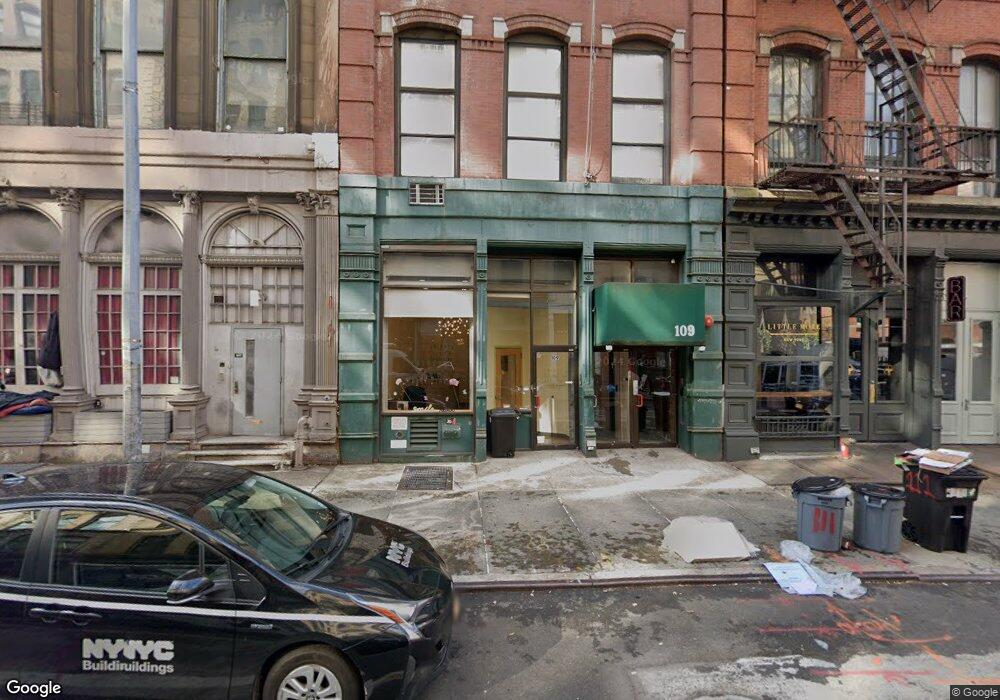
109 Reade St Unit G New York, NY 10013
Tribeca NeighborhoodEstimated Value: $2,393,852 - $2,841,000
--
Bed
--
Bath
1,377
Sq Ft
$1,929/Sq Ft
Est. Value
About This Home
This home is located at 109 Reade St Unit G, New York, NY 10013 and is currently estimated at $2,656,213, approximately $1,928 per square foot. 109 Reade St Unit G is a home located in New York County with nearby schools including P.S. 234 Independence School, Middle School 297, and Lower Manhattan Community Middle School.
Ownership History
Date
Name
Owned For
Owner Type
Purchase Details
Closed on
Jul 22, 2010
Sold by
Ford Christina and Steuer Arthur
Bought by
Taliercio Frank Charles and Taliercio Frank Charles
Current Estimated Value
Home Financials for this Owner
Home Financials are based on the most recent Mortgage that was taken out on this home.
Original Mortgage
$945,000
Outstanding Balance
$629,219
Interest Rate
4.76%
Mortgage Type
Purchase Money Mortgage
Estimated Equity
$2,026,994
Purchase Details
Closed on
Jul 13, 2010
Sold by
Ford Christina and Steuer Arthur
Bought by
Taliercio Frank Charles and Taliercio Frank Charles
Home Financials for this Owner
Home Financials are based on the most recent Mortgage that was taken out on this home.
Original Mortgage
$945,000
Outstanding Balance
$629,219
Interest Rate
4.76%
Mortgage Type
Purchase Money Mortgage
Estimated Equity
$2,026,994
Create a Home Valuation Report for This Property
The Home Valuation Report is an in-depth analysis detailing your home's value as well as a comparison with similar homes in the area
Home Values in the Area
Average Home Value in this Area
Purchase History
| Date | Buyer | Sale Price | Title Company |
|---|---|---|---|
| Taliercio Frank Charles | $1,350,000 | -- | |
| Taliercio Frank Charles | $1,350,000 | -- |
Source: Public Records
Mortgage History
| Date | Status | Borrower | Loan Amount |
|---|---|---|---|
| Open | Taliercio Frank Charles | $945,000 | |
| Closed | Taliercio Frank Charles | $945,000 |
Source: Public Records
Tax History Compared to Growth
Tax History
| Year | Tax Paid | Tax Assessment Tax Assessment Total Assessment is a certain percentage of the fair market value that is determined by local assessors to be the total taxable value of land and additions on the property. | Land | Improvement |
|---|---|---|---|---|
| 2025 | $28,509 | $235,443 | $16,998 | $218,445 |
| 2024 | $28,509 | $228,032 | $25,574 | $208,220 |
| 2023 | $25,904 | $211,172 | $19,777 | $191,395 |
| 2022 | $23,927 | $296,255 | $25,574 | $270,681 |
| 2021 | $22,217 | $236,003 | $25,574 | $210,429 |
| 2020 | $22,590 | $228,925 | $25,574 | $203,351 |
| 2019 | $22,082 | $211,480 | $25,574 | $185,906 |
| 2018 | $20,620 | $162,117 | $18,059 | $144,058 |
| 2017 | $19,092 | $150,109 | $18,963 | $131,146 |
| 2016 | $17,919 | $138,992 | $19,270 | $119,722 |
| 2015 | $9,597 | $138,992 | $19,381 | $119,611 |
| 2014 | $9,597 | $134,682 | $15,340 | $119,342 |
Source: Public Records
Map
Nearby Homes
- 105 Reade St
- 100 Reade St Unit 6CD
- 100 Reade St Unit 3C
- 126 Chambers St Unit 3
- 85 W Broadway Unit 14E
- 142 Duane St Unit 2B
- 142 Duane St Unit PH-2
- 132 Duane St
- 150 Chambers St Unit 3W
- 74 Warren St Unit 5
- 137 Duane St Unit 2D
- 143 Reade St Unit PH
- 166 Duane St Unit 8B
- 53 Warren St Unit 4
- 53 Warren St Unit 1
- 57 Warren St Unit 7
- 70 Thomas St Unit 5
- 74 Reade St Unit 1E
- 160 Chambers St Unit 4
- 161 Duane St Unit 4B
- 109 Reade St Unit C
- 109 Reade St Unit F
- 109 Reade St Unit E
- 109 Reade St Unit D
- 109 Reade St Unit H
- 109 Reade St Unit A
- 109 Reade St
- 109 Reade St Unit 5
- 109 Reade St Unit 2
- 109 Reade St Unit 6
- 109 Reade St Unit 5FL
- 109 Reade St Unit 3
- 109 Reade St Unit 4
- 111 Reade St Unit 5
- 111 Reade St Unit 2
- 111 Reade St Unit 2-FLR
- 111 Reade St
- 111 Reade St Unit 4
- 111 Reade St Unit PH5
- 111 Reade St Unit 3