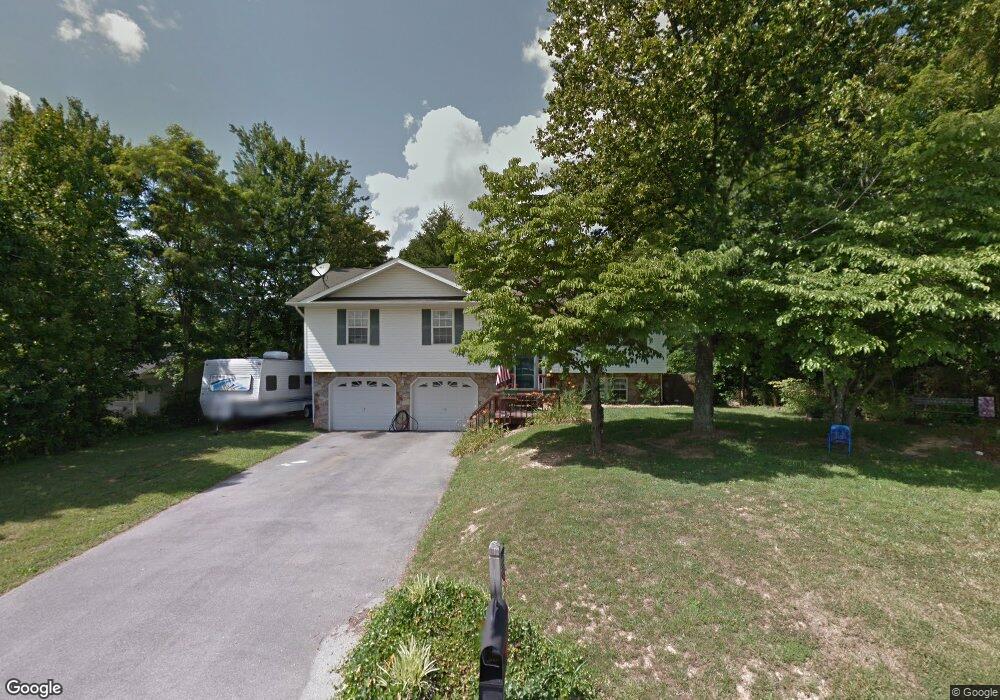
109 Ridge Circle Dr Fall Branch, TN 37656
Estimated Value: $291,000 - $358,000
4
Beds
2
Baths
1,720
Sq Ft
$186/Sq Ft
Est. Value
About This Home
This home is located at 109 Ridge Circle Dr, Fall Branch, TN 37656 and is currently estimated at $320,487, approximately $186 per square foot. 109 Ridge Circle Dr is a home located in Washington County with nearby schools including Fall Branch Elementary School and Daniel Boone High School.
Ownership History
Date
Name
Owned For
Owner Type
Purchase Details
Closed on
May 1, 2003
Sold by
Bruce Gary A
Bought by
Quillen Joshua
Current Estimated Value
Home Financials for this Owner
Home Financials are based on the most recent Mortgage that was taken out on this home.
Original Mortgage
$119,100
Outstanding Balance
$52,027
Interest Rate
5.86%
Estimated Equity
$268,460
Purchase Details
Closed on
May 12, 2000
Sold by
Powers Randall
Bought by
Bruce Gary A
Purchase Details
Closed on
Apr 5, 1999
Bought by
Powers Randall and Powers Sharon
Purchase Details
Closed on
Apr 15, 1997
Sold by
Morelock Harold Ray
Bought by
Rouse Keith
Home Financials for this Owner
Home Financials are based on the most recent Mortgage that was taken out on this home.
Original Mortgage
$7,500
Interest Rate
7.85%
Purchase Details
Closed on
Dec 22, 1995
Bought by
Morelock Harold
Purchase Details
Closed on
Dec 21, 1995
Bought by
Morelock Harold Ray
Create a Home Valuation Report for This Property
The Home Valuation Report is an in-depth analysis detailing your home's value as well as a comparison with similar homes in the area
Home Values in the Area
Average Home Value in this Area
Purchase History
| Date | Buyer | Sale Price | Title Company |
|---|---|---|---|
| Quillen Joshua | $120,000 | -- | |
| Bruce Gary A | $105,000 | -- | |
| Powers Randall | $15,500 | -- | |
| Rouse Keith | $10,500 | -- | |
| Morelock Harold | $9,100 | -- | |
| Morelock Harold Ray | $9,100 | -- |
Source: Public Records
Mortgage History
| Date | Status | Borrower | Loan Amount |
|---|---|---|---|
| Open | Morelock Harold Ray | $119,100 | |
| Previous Owner | Morelock Harold Ray | $7,500 |
Source: Public Records
Tax History Compared to Growth
Tax History
| Year | Tax Paid | Tax Assessment Tax Assessment Total Assessment is a certain percentage of the fair market value that is determined by local assessors to be the total taxable value of land and additions on the property. | Land | Improvement |
|---|---|---|---|---|
| 2024 | $914 | $53,425 | $4,650 | $48,775 |
| 2022 | $749 | $34,850 | $4,650 | $30,200 |
| 2021 | $749 | $34,850 | $4,650 | $30,200 |
| 2020 | $749 | $34,850 | $4,650 | $30,200 |
| 2019 | $829 | $34,850 | $4,650 | $30,200 |
| 2018 | $829 | $34,825 | $4,650 | $30,175 |
| 2017 | $829 | $34,825 | $4,650 | $30,175 |
| 2016 | $829 | $34,825 | $4,650 | $30,175 |
| 2015 | $689 | $34,825 | $4,650 | $30,175 |
| 2014 | $689 | $34,825 | $4,650 | $30,175 |
Source: Public Records
Map
Nearby Homes
- 180 Kincheloe Rd
- 3016 Highway 81
- 88/Ac Tbd Hwy 93
- 505 Jackson Rd
- 0 Tbd Highway 93 Unit LotWO001
- 480 Fordtown Rd
- 689 Painter Rd
- 2731 Highway 81 N
- 665 Painter Rd
- 545 Fordtown Rd
- Tr 1 Joe R McCrary Rd
- 2644 Highway 81 Jonesborough
- 474 Thornburg Rd
- 106 Davis Rd
- 17505 Kingsport Hwy
- 119 Good Rd
- 255 Bank Dr
- 243 Cherry Hill Rd
- 1415 Highway 93
- 120 Wheelock Rd
- 117 Ridge Circle Dr
- 101 Ridge Circle Dr
- 110 Ridge Circle Dr
- 100 Ridge Circle Dr
- 127 Ridge Circle Dr
- 118 Ridge Circle Dr
- 151 Ridge Circle Dr
- 139 Dogwood Hills Rd
- 133 Dogwood Hills Rd
- 152 Ridge Circle Dr
- 126 Ridge Circle Dr
- 146 Ridge Circle Dr
- 160 Dogwood Hills Rd
- 150 Ridge Circle Dr
- 00 Dogwood Hills Rd
- 125 Dogwood Hills Rd
- 138 Ridge Circle Dr
- 189 Dogwood Hills Rd
- 132 Ridge Circle Dr
- 182 Dogwood Hills Rd