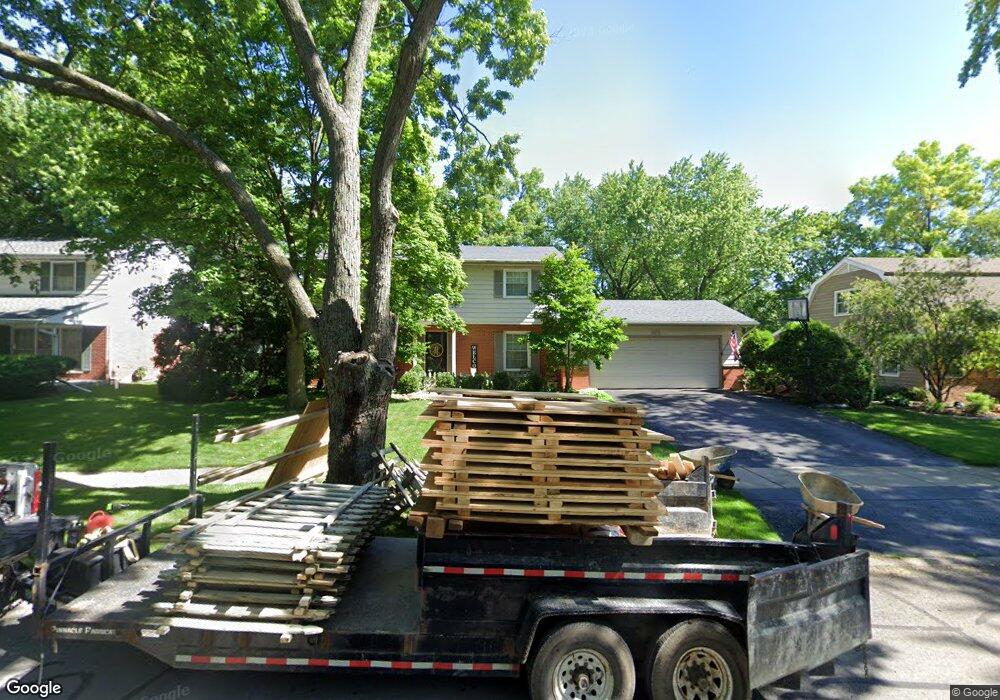
109 Thrush Ln Naperville, IL 60540
Maple Brook NeighborhoodEstimated Value: $509,942 - $604,000
Studio
1
Bath
2,004
Sq Ft
$278/Sq Ft
Est. Value
About This Home
This home is located at 109 Thrush Ln, Naperville, IL 60540 and is currently estimated at $557,736, approximately $278 per square foot. 109 Thrush Ln is a home located in DuPage County with nearby schools including Elmwood Elementary School, Lincoln Jr. High School, and Naperville Central High School.
Ownership History
Date
Name
Owned For
Owner Type
Purchase Details
Closed on
Aug 6, 2001
Sold by
Durham Gary and Durham Lucinda A
Bought by
Hornig Eric F and Hornig Catherine S
Current Estimated Value
Home Financials for this Owner
Home Financials are based on the most recent Mortgage that was taken out on this home.
Original Mortgage
$258,400
Outstanding Balance
$96,178
Interest Rate
7.15%
Estimated Equity
$461,558
Purchase Details
Closed on
May 26, 1999
Sold by
Odowd Terrance M and Odowd Marjorie A
Bought by
Swanson Lucinda
Create a Home Valuation Report for This Property
The Home Valuation Report is an in-depth analysis detailing your home's value as well as a comparison with similar homes in the area
Home Values in the Area
Average Home Value in this Area
Purchase History
| Date | Buyer | Sale Price | Title Company |
|---|---|---|---|
| Hornig Eric F | $272,000 | -- | |
| Swanson Lucinda | $235,000 | Collar Counties Title Plant |
Source: Public Records
Mortgage History
| Date | Status | Borrower | Loan Amount |
|---|---|---|---|
| Open | Hornig Eric F | $258,400 |
Source: Public Records
Tax History
| Year | Tax Paid | Tax Assessment Tax Assessment Total Assessment is a certain percentage of the fair market value that is determined by local assessors to be the total taxable value of land and additions on the property. | Land | Improvement |
|---|---|---|---|---|
| 2024 | $9,120 | $156,872 | $76,272 | $80,600 |
| 2023 | $8,783 | $143,170 | $69,610 | $73,560 |
| 2022 | $8,113 | $131,350 | $63,860 | $67,490 |
| 2021 | $7,814 | $126,380 | $61,440 | $64,940 |
| 2020 | $7,646 | $124,110 | $60,340 | $63,770 |
| 2019 | $7,421 | $118,740 | $57,730 | $61,010 |
| 2018 | $7,232 | $115,840 | $56,320 | $59,520 |
| 2017 | $7,084 | $111,930 | $54,420 | $57,510 |
| 2016 | $6,939 | $107,880 | $52,450 | $55,430 |
| 2015 | $6,891 | $101,590 | $49,390 | $52,200 |
| 2014 | $6,843 | $97,930 | $47,610 | $50,320 |
| 2013 | $6,740 | $98,160 | $47,720 | $50,440 |
Source: Public Records
Map
Nearby Homes
- 313 W Gartner Rd
- 316 Sycamore Dr Unit 11
- 908 Julian Ct
- 923 Tim Tam Cir
- 8S452 Bell Dr
- 907 Secretariat Dr
- 616 Driftwood Ct
- 1172 Kenilworth Cir
- 1449 Whitespire Ct Unit 5104
- 510 Harlowe Ln Unit 2001C
- 1546 Treeline Ct Unit 405
- 124 E Bailey Rd Unit E
- 1751 S Washington St Unit 1
- 1754 S Washington St Unit 1754
- 706 S Loomis St Unit D
- 144 E Bailey Rd Unit D
- 138 E Bailey Rd Unit M
- 228 E Bailey Rd Unit F
- 845 Tulip Ln
- 316 Hemlock Ln
Your Personal Tour Guide
Ask me questions while you tour the home.