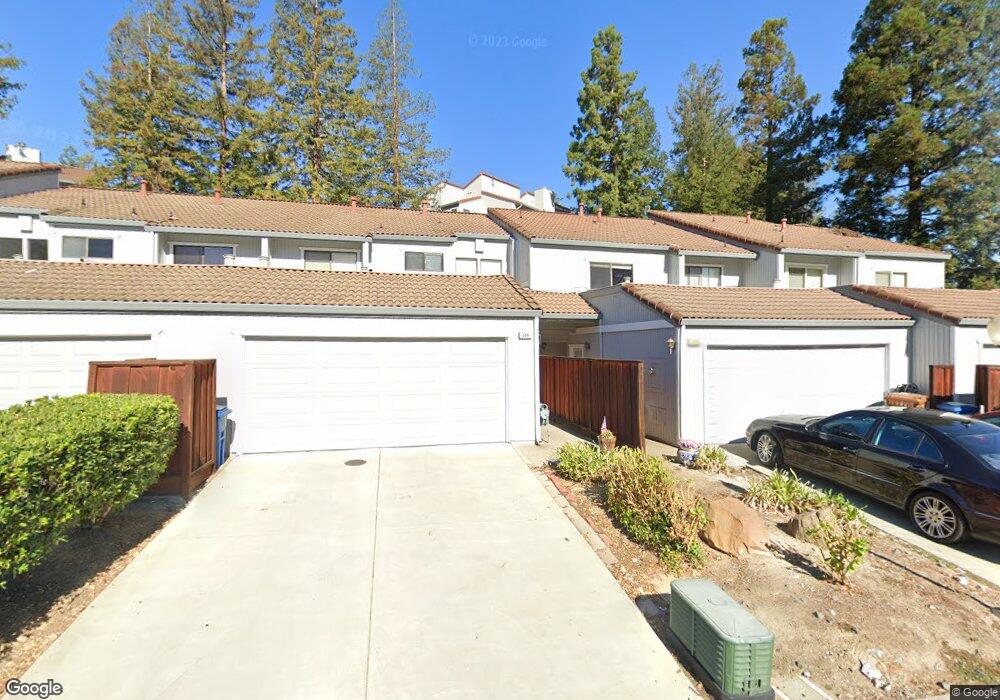
109 Via Cabrera Ln Martinez, CA 94553
Estimated Value: $502,000 - $680,000
2
Beds
3
Baths
1,301
Sq Ft
$455/Sq Ft
Est. Value
About This Home
This home is located at 109 Via Cabrera Ln, Martinez, CA 94553 and is currently estimated at $592,222, approximately $455 per square foot. 109 Via Cabrera Ln is a home located in Contra Costa County with nearby schools including John Muir Elementary School, Martinez Junior High School, and Alhambra Senior High School.
Ownership History
Date
Name
Owned For
Owner Type
Purchase Details
Closed on
Apr 14, 2009
Sold by
Mc Real Estate Development Llc
Bought by
Nemanick Julie
Current Estimated Value
Home Financials for this Owner
Home Financials are based on the most recent Mortgage that was taken out on this home.
Original Mortgage
$185,580
Outstanding Balance
$118,758
Interest Rate
5.17%
Mortgage Type
Purchase Money Mortgage
Estimated Equity
$473,464
Purchase Details
Closed on
Feb 24, 2009
Sold by
Overell Alison
Bought by
Mc Real Estate Development Llc
Home Financials for this Owner
Home Financials are based on the most recent Mortgage that was taken out on this home.
Original Mortgage
$185,580
Outstanding Balance
$118,758
Interest Rate
5.17%
Mortgage Type
Purchase Money Mortgage
Estimated Equity
$473,464
Purchase Details
Closed on
May 17, 2006
Sold by
Overell Alison
Bought by
Overell Alison
Purchase Details
Closed on
Apr 13, 2005
Sold by
Svehlak Mark R and Svehlak Connie P
Bought by
Overell Alison
Home Financials for this Owner
Home Financials are based on the most recent Mortgage that was taken out on this home.
Original Mortgage
$336,000
Interest Rate
5.37%
Mortgage Type
Purchase Money Mortgage
Create a Home Valuation Report for This Property
The Home Valuation Report is an in-depth analysis detailing your home's value as well as a comparison with similar homes in the area
Home Values in the Area
Average Home Value in this Area
Purchase History
| Date | Buyer | Sale Price | Title Company |
|---|---|---|---|
| Nemanick Julie | $206,500 | North American Title Company | |
| Mc Real Estate Development Llc | $148,000 | None Available | |
| Overell Alison | -- | None Available | |
| Overell Alison | $420,000 | Ticor Title Company |
Source: Public Records
Mortgage History
| Date | Status | Borrower | Loan Amount |
|---|---|---|---|
| Open | Nemanick Julie | $185,580 | |
| Previous Owner | Overell Alison | $336,000 | |
| Closed | Overell Alison | $63,000 |
Source: Public Records
Tax History Compared to Growth
Tax History
| Year | Tax Paid | Tax Assessment Tax Assessment Total Assessment is a certain percentage of the fair market value that is determined by local assessors to be the total taxable value of land and additions on the property. | Land | Improvement |
|---|---|---|---|---|
| 2025 | $4,070 | $265,519 | $94,254 | $171,265 |
| 2024 | $3,939 | $260,313 | $92,406 | $167,907 |
| 2023 | $3,939 | $255,210 | $90,595 | $164,615 |
| 2022 | $3,814 | $250,207 | $88,819 | $161,388 |
| 2021 | $3,627 | $245,302 | $87,078 | $158,224 |
| 2019 | $3,437 | $238,029 | $84,497 | $153,532 |
| 2018 | $3,322 | $233,363 | $82,841 | $150,522 |
| 2017 | $3,270 | $228,788 | $81,217 | $147,571 |
| 2016 | $3,050 | $224,303 | $79,625 | $144,678 |
| 2015 | $3,022 | $220,934 | $78,429 | $142,505 |
| 2014 | $2,977 | $216,607 | $76,893 | $139,714 |
Source: Public Records
Map
Nearby Homes
- 105 Via Cabrera Ln
- 128 Via Cabrera Ln
- 321 Via Cordova Ln
- 235 Via Pinada Ln
- 242 Via el Dorado Ln
- 246 Via el Dorado Ln
- 3215 Pine St
- 3102 Pine St
- 225 Laurel Knoll Dr
- 655 Center Ave
- 300 Lodgepole Ct
- 512 Laurel Knoll Ct
- 830 Westview Ct
- 821 Center Ave
- 221 Village Place
- 824 Center Ave
- 150 Farm Ln
- 35 Hilltop Rd
- 186 Farm Ln
- 626 E St
- 107 Via Cabrera Ln
- 111 Via Cabrera Ln
- 113 Via Cabrera Ln
- 103 Via Cabrera Ln
- 320 Via Cordova Ln
- 322 Via Cordova Ln
- 124 Via Cabrera Ln
- 122 Via Cabrera Ln
- 126 Via Cabrera Ln
- 120 Via Cabrera Ln
- 314 Via Cordova Ln
- 324 Via Cordova Ln
- 118 Via Cabrera Ln
- 312 Via Cordova Ln
- 326 Via Cordova Ln
- 310 Via Cordova Ln
- 102 Via Cabrera Ln
- 104 Via Cabrera Ln
- 106 Via Cabrera Ln
- 108 Via Cabrera Ln