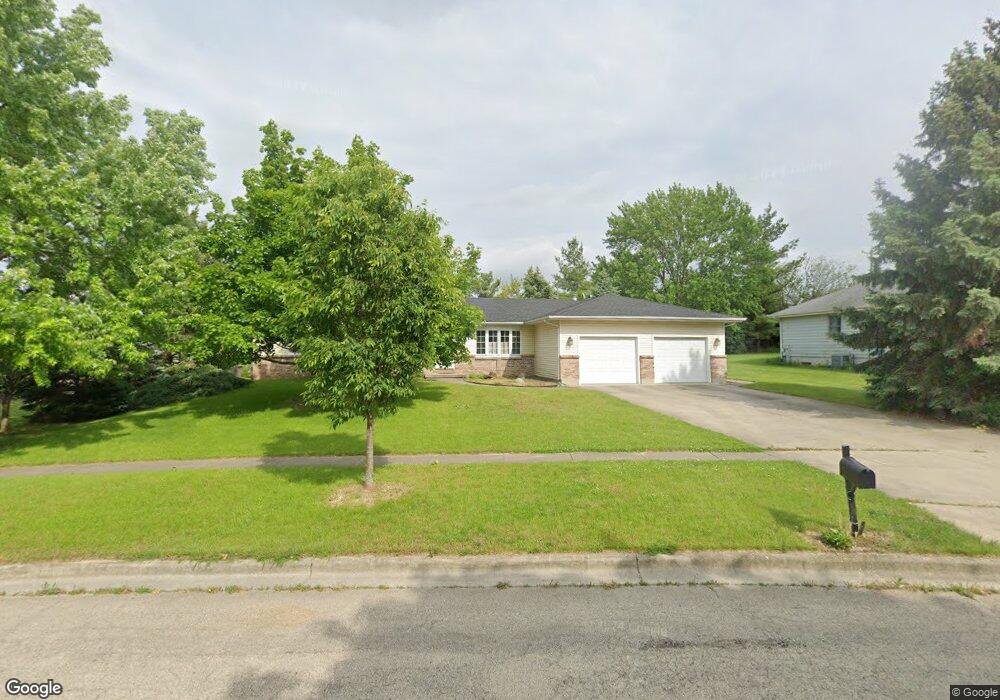
109 West End Ct Oswego, IL 60543
Downtown Oswego NeighborhoodEstimated Value: $364,000 - $399,000
3
Beds
2
Baths
1,726
Sq Ft
$221/Sq Ft
Est. Value
About This Home
This home is located at 109 West End Ct, Oswego, IL 60543 and is currently estimated at $381,165, approximately $220 per square foot. 109 West End Ct is a home located in Kendall County with nearby schools including Southbury Elementary School, Traughber Junior High School, and Oswego High School.
Ownership History
Date
Name
Owned For
Owner Type
Purchase Details
Closed on
Sep 17, 2007
Sold by
Hofner Tim and Hofner Chris
Bought by
Moyer Cheryl A
Current Estimated Value
Home Financials for this Owner
Home Financials are based on the most recent Mortgage that was taken out on this home.
Original Mortgage
$50,000
Outstanding Balance
$31,543
Interest Rate
6.5%
Mortgage Type
Purchase Money Mortgage
Estimated Equity
$349,622
Purchase Details
Closed on
Aug 2, 2007
Sold by
Schuster Barbara A
Bought by
Hofner Tim and Hofner Chris
Home Financials for this Owner
Home Financials are based on the most recent Mortgage that was taken out on this home.
Original Mortgage
$50,000
Outstanding Balance
$31,543
Interest Rate
6.5%
Mortgage Type
Purchase Money Mortgage
Estimated Equity
$349,622
Purchase Details
Closed on
Sep 1, 1993
Bought by
Schuster Barbara A Trust
Create a Home Valuation Report for This Property
The Home Valuation Report is an in-depth analysis detailing your home's value as well as a comparison with similar homes in the area
Home Values in the Area
Average Home Value in this Area
Purchase History
| Date | Buyer | Sale Price | Title Company |
|---|---|---|---|
| Moyer Cheryl A | $245,000 | Attorneys Title Guaranty Fun | |
| Hofner Tim | $185,000 | Law Title Joliet | |
| Schuster Barbara A Trust | $40,000 | -- |
Source: Public Records
Mortgage History
| Date | Status | Borrower | Loan Amount |
|---|---|---|---|
| Open | Moyer Cheryl A | $50,000 | |
| Closed | Schuster Barbara A Trust | -- |
Source: Public Records
Tax History Compared to Growth
Tax History
| Year | Tax Paid | Tax Assessment Tax Assessment Total Assessment is a certain percentage of the fair market value that is determined by local assessors to be the total taxable value of land and additions on the property. | Land | Improvement |
|---|---|---|---|---|
| 2024 | $7,836 | $103,372 | $21,850 | $81,522 |
| 2023 | $7,173 | $93,128 | $19,685 | $73,443 |
| 2022 | $7,173 | $85,439 | $18,060 | $67,379 |
| 2021 | $6,841 | $79,110 | $16,722 | $62,388 |
| 2020 | $6,690 | $76,806 | $16,235 | $60,571 |
| 2019 | $6,468 | $73,378 | $16,235 | $57,143 |
| 2018 | $6,962 | $71,728 | $15,870 | $55,858 |
| 2017 | $7,353 | $71,728 | $15,870 | $55,858 |
| 2016 | $7,243 | $69,639 | $15,408 | $54,231 |
| 2015 | $7,304 | $66,960 | $14,815 | $52,145 |
| 2014 | -- | $64,384 | $14,245 | $50,139 |
| 2013 | -- | $67,067 | $14,839 | $52,228 |
Source: Public Records
Map
Nearby Homes
- 371 S Madison St
- 114 Riverview Ct
- 5161 US Highway 34
- 5055 U S 34
- 206 E Washington St
- 613 Murdock Place
- 388 Danforth Dr
- 423 Hathaway Ln
- 610 Murdock Place
- 611 Murdock Place
- 421 Hathaway Ln
- 616 Briarwood Ln
- 395 Danforth Dr
- 125 Presidential Blvd Unit 3248
- 714 Pinehurst Ln
- 34 N Adams St
- 177 Franklin St
- 505 Parkland Ct
- 315 White Pines Ln
- 55 Garfield St
- 113 West End Ct
- 105 W End Ct
- 105 West End Ct
- 484 Madison Ct
- 520 Douglas St
- 480 Madison Ct
- 125 West End Ct
- 125 W End Ct
- 488 S Madison St
- 121 West End Ct
- 121 W End Ct
- 117 West End Ct
- 476 Madison Ct
- 101 Iris Ct Unit 1
- 101 Iris Ct
- 103 Iris Ct Unit 1
- 472 Madison Ct
- 105 Iris Ct
- 468 S Madison St
- 473 S Madison St