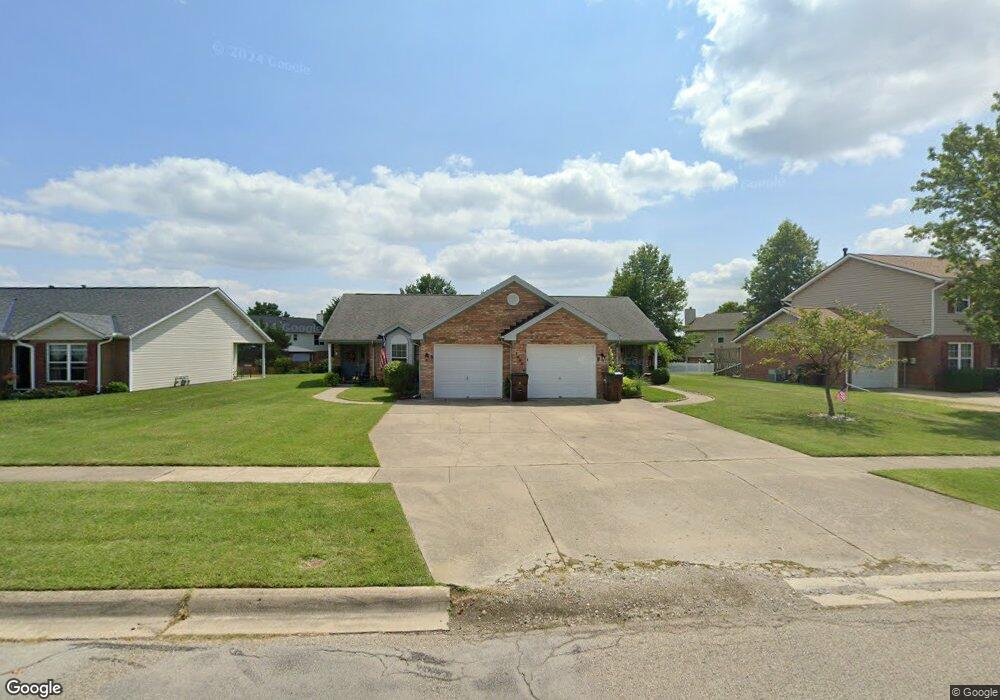
1090 Hunters Run Dr Lebanon, OH 45036
Estimated Value: $318,000 - $374,877
4
Beds
4
Baths
2,474
Sq Ft
$140/Sq Ft
Est. Value
About This Home
This home is located at 1090 Hunters Run Dr, Lebanon, OH 45036 and is currently estimated at $346,969, approximately $140 per square foot. 1090 Hunters Run Dr is a home located in Warren County with nearby schools including Bowman Primary School, Berry Intermediate School, and Donovan Elementary School.
Ownership History
Date
Name
Owned For
Owner Type
Purchase Details
Closed on
Jan 10, 2023
Sold by
Pennekamp Lee P and Pennekamp Malinda Carole
Bought by
1090 Hunters Run Llc
Current Estimated Value
Purchase Details
Closed on
Sep 22, 2011
Sold by
Jandes Janet M K and Jandes James K
Bought by
Pennekamp Leroy G and Pennekamp Lee P
Home Financials for this Owner
Home Financials are based on the most recent Mortgage that was taken out on this home.
Original Mortgage
$120,000
Interest Rate
4.12%
Mortgage Type
New Conventional
Purchase Details
Closed on
Mar 7, 2004
Sold by
Jandes James K and Jandes Janet M
Bought by
Jandes James K and Jandes Janet M
Purchase Details
Closed on
Mar 25, 1992
Sold by
Wesreal & Inc
Bought by
Jandes Jandes and Jandes James K
Purchase Details
Closed on
Nov 29, 1991
Bought by
Wesreal & Inc.
Create a Home Valuation Report for This Property
The Home Valuation Report is an in-depth analysis detailing your home's value as well as a comparison with similar homes in the area
Home Values in the Area
Average Home Value in this Area
Purchase History
| Date | Buyer | Sale Price | Title Company |
|---|---|---|---|
| 1090 Hunters Run Llc | -- | None Listed On Document | |
| Pennekamp Leroy G | $170,000 | Safetitle Agency Inc | |
| Jandes James K | -- | -- | |
| Jandes Jandes | $26,000 | -- | |
| Wesreal & Inc. | -- | -- |
Source: Public Records
Mortgage History
| Date | Status | Borrower | Loan Amount |
|---|---|---|---|
| Previous Owner | Pennekamp Leroy G | $120,000 |
Source: Public Records
Tax History Compared to Growth
Tax History
| Year | Tax Paid | Tax Assessment Tax Assessment Total Assessment is a certain percentage of the fair market value that is determined by local assessors to be the total taxable value of land and additions on the property. | Land | Improvement |
|---|---|---|---|---|
| 2024 | $4,060 | $95,550 | $8,750 | $86,800 |
| 2023 | $4,105 | $87,843 | $10,762 | $77,080 |
| 2022 | $4,276 | $87,843 | $10,763 | $77,081 |
| 2021 | $4,040 | $87,843 | $10,763 | $77,081 |
| 2020 | $3,889 | $71,418 | $8,750 | $62,668 |
| 2019 | $3,907 | $71,418 | $8,750 | $62,668 |
| 2018 | $3,355 | $71,418 | $8,750 | $62,668 |
| 2017 | $3,110 | $59,420 | $6,937 | $52,483 |
| 2016 | $3,209 | $59,420 | $6,937 | $52,483 |
| 2015 | $3,232 | $59,420 | $6,937 | $52,483 |
| 2014 | $3,268 | $57,690 | $6,730 | $50,950 |
| 2013 | $3,149 | $74,960 | $8,750 | $66,210 |
Source: Public Records
Map
Nearby Homes
- 1086 Hunters Run Dr
- 1094 Hunters Run Dr
- 822 Teakwood Ct
- 1098 Hunters Run Dr
- 826 Teakwood Ct
- 818 Teakwood Ct
- 914 Mimosa Ct
- 1093 Hunters Run Dr
- 875 Arrowood Ct
- 830 Teakwood Ct
- 899 Mimosa Ct
- 1102 Hunters Run Dr
- 1097 Hunters Run Dr
- 1101 Hunters Run Dr
- 814 Owlwood Ct
- 910 Mimosa Ct
- 825 Teakwood Ct
- 0 Owlwood Ct
- 879 Arrowood Ct
- 834 Teakwood Ct