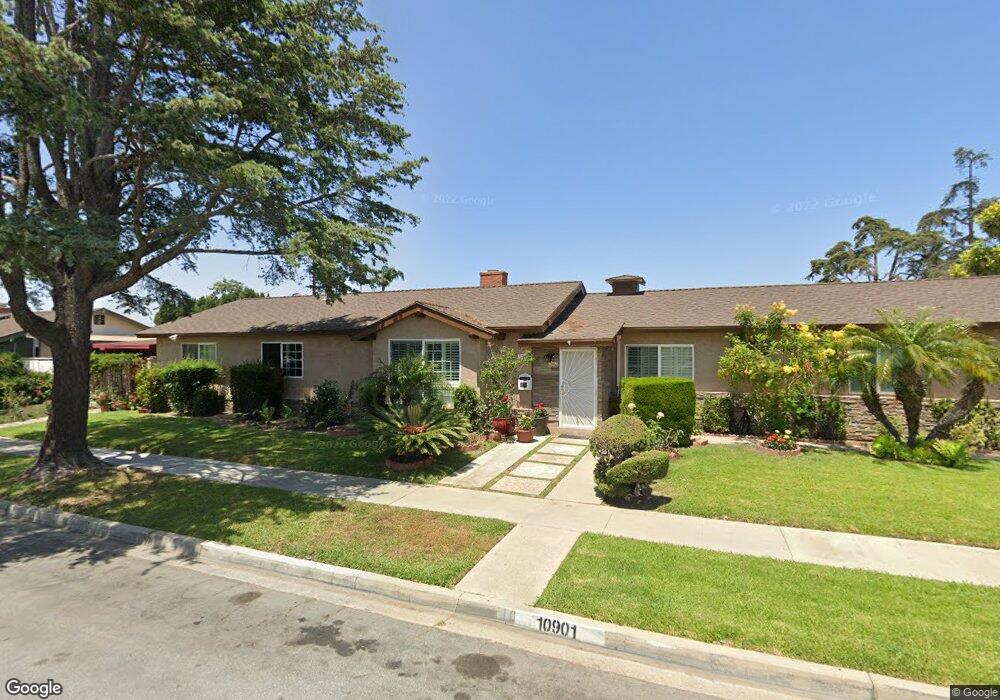
10901 Holly Dr Garden Grove, CA 92840
Estimated Value: $963,000 - $1,210,000
4
Beds
4
Baths
1,541
Sq Ft
$689/Sq Ft
Est. Value
About This Home
This home is located at 10901 Holly Dr, Garden Grove, CA 92840 and is currently estimated at $1,061,166, approximately $688 per square foot. 10901 Holly Dr is a home located in Orange County with nearby schools including Ethel M. Evans Elementary School, Garden Grove High School, and St. Columban School.
Ownership History
Date
Name
Owned For
Owner Type
Purchase Details
Closed on
Aug 19, 2015
Sold by
Huynh Trina and Nguyen Can Ngoc
Bought by
Huynh Trina
Current Estimated Value
Home Financials for this Owner
Home Financials are based on the most recent Mortgage that was taken out on this home.
Original Mortgage
$350,000
Outstanding Balance
$274,710
Interest Rate
3.97%
Mortgage Type
Purchase Money Mortgage
Estimated Equity
$786,456
Purchase Details
Closed on
Jul 21, 2014
Sold by
Huynh Trina
Bought by
Huynh Trina and Nguyen Can Ngoc
Purchase Details
Closed on
May 4, 2001
Sold by
Lagrange Fred and Lagrange Mary
Bought by
Huynh Trina
Home Financials for this Owner
Home Financials are based on the most recent Mortgage that was taken out on this home.
Original Mortgage
$199,200
Interest Rate
7.06%
Purchase Details
Closed on
Nov 6, 1996
Sold by
Johnson Marian T
Bought by
Johnson Marian T and The Marian T Johnson Living Trust
Create a Home Valuation Report for This Property
The Home Valuation Report is an in-depth analysis detailing your home's value as well as a comparison with similar homes in the area
Home Values in the Area
Average Home Value in this Area
Purchase History
| Date | Buyer | Sale Price | Title Company |
|---|---|---|---|
| Huynh Trina | -- | Wfg Title Co Of California | |
| Nguyen Can Ngoc | -- | Wfg Title Company Of Ca | |
| Huynh Trina | -- | None Available | |
| Nguyen Can Ngoc | -- | None Available | |
| Huynh Trina | $249,000 | American Title Co | |
| Johnson Marian T | -- | -- |
Source: Public Records
Mortgage History
| Date | Status | Borrower | Loan Amount |
|---|---|---|---|
| Open | Huynh Trina | $350,000 | |
| Closed | Huynh Trina | $199,200 |
Source: Public Records
Tax History Compared to Growth
Tax History
| Year | Tax Paid | Tax Assessment Tax Assessment Total Assessment is a certain percentage of the fair market value that is determined by local assessors to be the total taxable value of land and additions on the property. | Land | Improvement |
|---|---|---|---|---|
| 2025 | $4,861 | $390,882 | $286,440 | $104,442 |
| 2024 | $4,861 | $383,218 | $280,823 | $102,395 |
| 2023 | $4,769 | $375,704 | $275,316 | $100,388 |
| 2022 | $4,666 | $368,338 | $269,918 | $98,420 |
| 2021 | $4,615 | $361,116 | $264,625 | $96,491 |
| 2020 | $4,553 | $357,414 | $261,912 | $95,502 |
| 2019 | $4,466 | $350,406 | $256,776 | $93,630 |
| 2018 | $4,376 | $343,536 | $251,741 | $91,795 |
| 2017 | $4,315 | $336,800 | $246,804 | $89,996 |
| 2016 | $4,103 | $330,197 | $241,965 | $88,232 |
| 2015 | $4,045 | $325,238 | $238,331 | $86,907 |
| 2014 | $3,947 | $318,868 | $233,663 | $85,205 |
Source: Public Records
Map
Nearby Homes
- 12256 Lesley St
- 12332 Euclid St
- 11081 Iris Dr
- 11102 Avolencia Place
- 12555 S Euclid St Unit 32
- 12555 Euclid St Unit 79
- 12555 Euclid St Unit 61
- 11052 Peppertree Ln
- 12071 Diane St
- 12600 Euclid St Unit 19
- 10882 Chapman Ave
- 10560 Lakeside Dr N Unit B
- 10580 Lakeside Dr N Unit E
- 10521 Lakeside Dr S Unit I
- 11252 Chapman Ave
- 10520 Lakeside Dr N Unit L
- 10541 Lakeside Dr S Unit P
- 10442 Lampson Ave
- 12262 Morrie Ln
- 12677 8th St
- 12301 Lesley St
- 12291 Lesley St
- 10881 Holly Dr
- 12302 Ellen St
- 10892 Holly Dr
- 10902 Holly Dr
- 10882 Holly Dr
- 12292 Ellen St
- 12281 Lesley St
- 12312 Lesley St
- 12302 Lesley St
- 10922 Holly Dr
- 10872 Holly Dr
- 12332 Lesley St
- 12292 Lesley St
- 12282 Ellen St
- 12271 Lesley St
- 10942 Holly Dr
- 10852 Holly Dr
- 12282 Lesley St