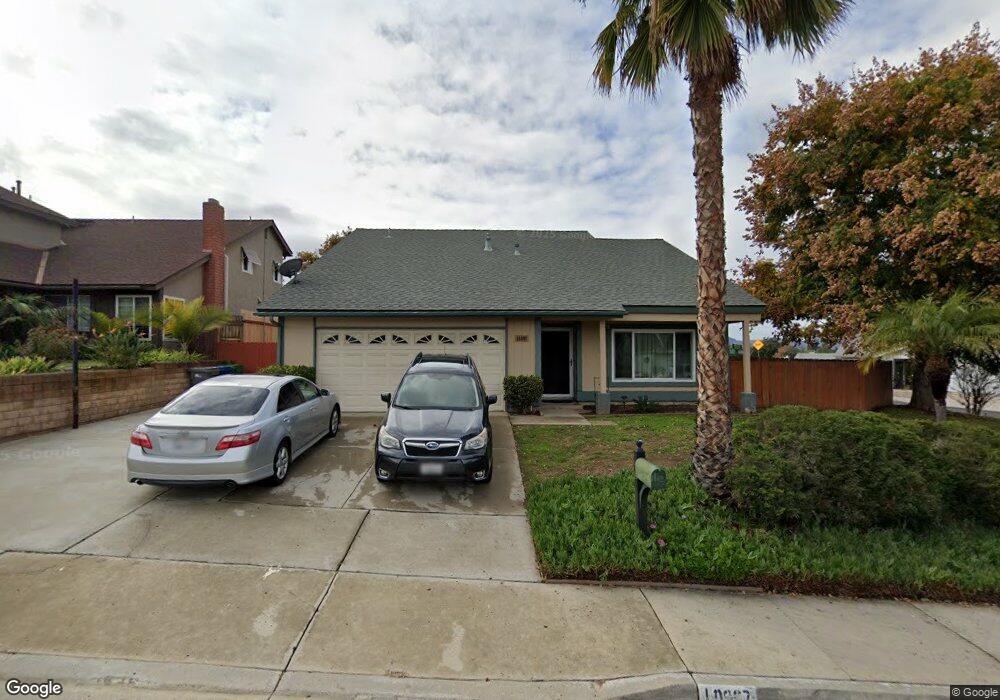
10907 Crystal Springs Rd Santee, CA 92071
Estimated Value: $887,469 - $911,000
4
Beds
3
Baths
1,817
Sq Ft
$496/Sq Ft
Est. Value
About This Home
This home is located at 10907 Crystal Springs Rd, Santee, CA 92071 and is currently estimated at $900,367, approximately $495 per square foot. 10907 Crystal Springs Rd is a home located in San Diego County with nearby schools including Pepper Drive Elementary School, Santana High School, and River Valley Charter School.
Ownership History
Date
Name
Owned For
Owner Type
Purchase Details
Closed on
Dec 16, 2016
Sold by
Wood Michael
Bought by
Simmons Sean T and Simmons Elizabeth D
Current Estimated Value
Home Financials for this Owner
Home Financials are based on the most recent Mortgage that was taken out on this home.
Original Mortgage
$490,000
Outstanding Balance
$401,768
Interest Rate
4.03%
Mortgage Type
VA
Estimated Equity
$498,599
Purchase Details
Closed on
Dec 13, 2016
Sold by
Wood Maria
Bought by
Wood Michael
Home Financials for this Owner
Home Financials are based on the most recent Mortgage that was taken out on this home.
Original Mortgage
$490,000
Outstanding Balance
$401,768
Interest Rate
4.03%
Mortgage Type
VA
Estimated Equity
$498,599
Purchase Details
Closed on
Jun 12, 1987
Bought by
Wood Michael Kathleen
Create a Home Valuation Report for This Property
The Home Valuation Report is an in-depth analysis detailing your home's value as well as a comparison with similar homes in the area
Home Values in the Area
Average Home Value in this Area
Purchase History
| Date | Buyer | Sale Price | Title Company |
|---|---|---|---|
| Simmons Sean T | $490,000 | First American Title Ins Co | |
| Wood Michael | -- | First American Title Ins Co | |
| Wood Michael Kathleen | $134,000 | -- |
Source: Public Records
Mortgage History
| Date | Status | Borrower | Loan Amount |
|---|---|---|---|
| Open | Simmons Sean T | $490,000 |
Source: Public Records
Tax History Compared to Growth
Tax History
| Year | Tax Paid | Tax Assessment Tax Assessment Total Assessment is a certain percentage of the fair market value that is determined by local assessors to be the total taxable value of land and additions on the property. | Land | Improvement |
|---|---|---|---|---|
| 2025 | $6,668 | $568,680 | $200,542 | $368,138 |
| 2024 | $6,668 | $557,530 | $196,610 | $360,920 |
| 2023 | $6,463 | $546,599 | $192,755 | $353,844 |
| 2022 | $6,416 | $535,882 | $188,976 | $346,906 |
| 2021 | $6,327 | $525,375 | $185,271 | $340,104 |
| 2020 | $6,248 | $519,989 | $183,372 | $336,617 |
| 2019 | $6,027 | $509,794 | $179,777 | $330,017 |
| 2018 | $5,918 | $499,799 | $176,252 | $323,547 |
| 2017 | $2,710 | $225,387 | $79,482 | $145,905 |
| 2016 | $2,627 | $220,969 | $77,924 | $143,045 |
| 2015 | $2,591 | $217,651 | $76,754 | $140,897 |
| 2014 | $2,539 | $213,389 | $75,251 | $138,138 |
Source: Public Records
Map
Nearby Homes
- 10969 Crystal Springs Rd
- 3042 Cole Grade Dr
- 1050 Iron Wheel St
- 11061 Crystal Springs Rd
- 11007 Larkridge St
- 10791 Jeanne Terrace Unit A
- 1605 Calabria St
- 1705 Montilla St
- 9126 Heatherdale St
- 1110 Calabria St Unit 10
- 9255 N Magnolia Ave Unit 333
- 9255 N Magnolia Ave Unit 350
- 9255 N Magnolia Ave Unit SPC 356
- 9255 N Magnolia Ave Unit 46
- 8731 Graves Ave Unit 42
- 10727 Holly Meadows Dr Unit A
- 10664 Sandy Creek Dr
- 8712 N Magnolia Ave Unit 289
- 8712 N Magnolia Ave Unit 169
- 8712 N Magnolia Ave Unit 15
- 10917 Crystal Springs Rd
- 10927 Crystal Springs Rd
- 10904 Eddington Rd
- 10912 Crystal Springs Rd
- 10918 Crystal Springs Rd
- 10952 Collinwood Dr
- 10935 Crystal Springs Rd
- 10958 Collinwood Dr
- 10906 Crystal Springs Rd
- 10924 Crystal Springs Rd
- 10940 Collinwood Dr
- 10964 Collinwood Dr
- 10910 Eddington Rd
- 10930 Crystal Springs Rd
- 10939 Crystal Springs Rd
- 10934 Collinwood Dr
- 10970 Collinwood Dr
- 11029 Collinwood Dr
- 11023 Collinwood Dr
- 10936 Crystal Springs Rd