
Seller's Agent in 2018
Nolasco Blandon
Compass Real Estate
(951) 415-6161
7 in this area
146 Total Sales
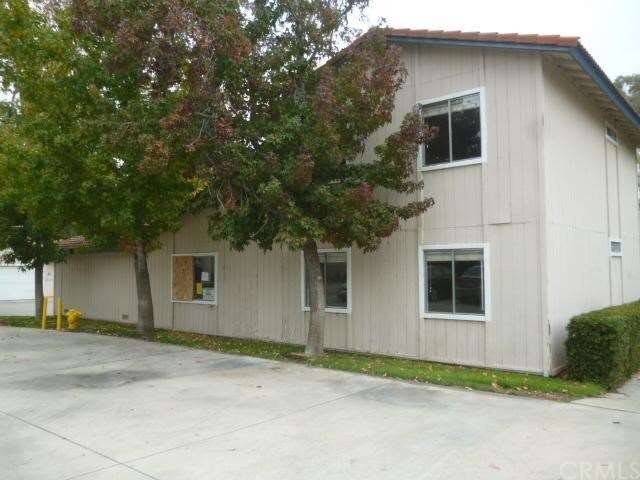
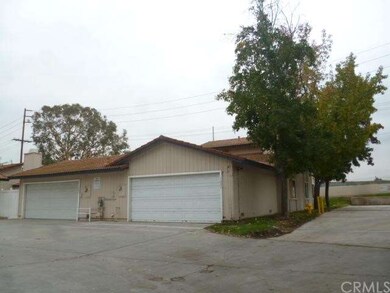
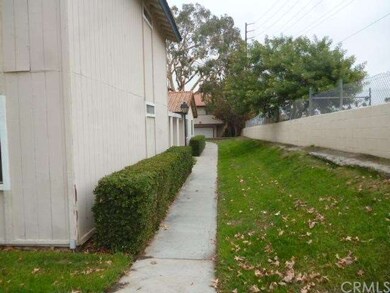
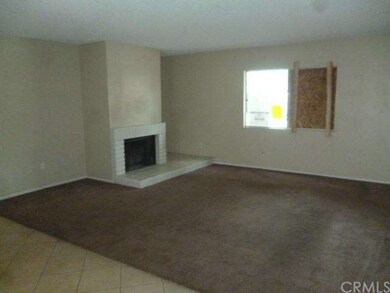
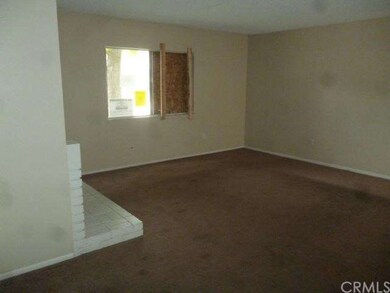
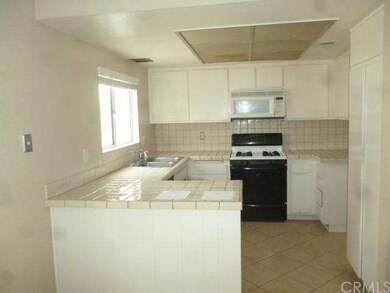
Great potential in this bi-level 3 Bedroom CONDO! Two full bathrooms, open kitchen with breakfast bar and eating area, 2-Car attached garage with laundry hookups, and an enclosed rear patio.
Last Agent to Sell the Property
Top Producers Realty, Ryjen Group License #00357066 Listed on: 11/12/2013
Last Buyer's Agent
Top Producers Realty, Ryjen Group License #00357066 Listed on: 11/12/2013
| Date | Type | Sale Price | Title Company |
|---|---|---|---|
| Grant Deed | $355,000 | Western Resources Title Comp | |
| Grant Deed | $310,000 | Wfg Title Company Of Califor | |
| Grant Deed | $222,000 | Lsi Title Company | |
| Interfamily Deed Transfer | -- | Lsi Title Company Inc | |
| Grant Deed | $215,000 | Lsi Title Company Inc | |
| Trustee Deed | $168,000 | Accommodation | |
| Interfamily Deed Transfer | -- | Southland Title | |
| Interfamily Deed Transfer | -- | Commonwealth Land Title Co | |
| Grant Deed | $149,000 | Commonwealth Land Title Co |
| Date | Status | Loan Amount | Loan Type |
|---|---|---|---|
| Open | $315,000 | New Conventional | |
| Closed | $315,000 | New Conventional | |
| Closed | $319,500 | New Conventional | |
| Previous Owner | $210,900 | New Conventional | |
| Previous Owner | $245,000 | Negative Amortization | |
| Previous Owner | $194,350 | Unknown | |
| Previous Owner | $151,000 | Purchase Money Mortgage | |
| Previous Owner | $146,697 | FHA |
| Date | Event | Price | Change | Sq Ft Price |
|---|---|---|---|---|
| 02/23/2018 02/23/18 | Sold | $355,000 | +1.5% | $217 / Sq Ft |
| 01/17/2018 01/17/18 | Pending | -- | -- | -- |
| 01/09/2018 01/09/18 | For Sale | $349,900 | +12.9% | $213 / Sq Ft |
| 08/23/2017 08/23/17 | Sold | $310,000 | -6.0% | $189 / Sq Ft |
| 07/29/2017 07/29/17 | Pending | -- | -- | -- |
| 07/18/2017 07/18/17 | Price Changed | $329,900 | -2.7% | $201 / Sq Ft |
| 06/26/2017 06/26/17 | Price Changed | $339,000 | -0.3% | $207 / Sq Ft |
| 06/25/2017 06/25/17 | For Sale | $340,000 | +53.2% | $207 / Sq Ft |
| 03/27/2014 03/27/14 | Sold | $222,000 | -5.5% | $135 / Sq Ft |
| 02/28/2014 02/28/14 | Pending | -- | -- | -- |
| 02/14/2014 02/14/14 | For Sale | $235,000 | +9.3% | $143 / Sq Ft |
| 01/07/2014 01/07/14 | Sold | $215,000 | -4.2% | $131 / Sq Ft |
| 12/19/2013 12/19/13 | Pending | -- | -- | -- |
| 12/11/2013 12/11/13 | Price Changed | $224,500 | -7.2% | $137 / Sq Ft |
| 11/12/2013 11/12/13 | For Sale | $242,000 | -- | $148 / Sq Ft |
| Year | Tax Paid | Tax Assessment Tax Assessment Total Assessment is a certain percentage of the fair market value that is determined by local assessors to be the total taxable value of land and additions on the property. | Land | Improvement |
|---|---|---|---|---|
| 2025 | $4,430 | $750,961 | $56,889 | $694,072 |
| 2023 | $4,430 | $388,242 | $54,681 | $333,561 |
| 2022 | $4,290 | $380,630 | $53,609 | $327,021 |
| 2021 | $4,206 | $373,167 | $52,558 | $320,609 |
| 2020 | $4,160 | $369,342 | $52,020 | $317,322 |
| 2019 | $4,064 | $362,100 | $51,000 | $311,100 |
| 2018 | $3,473 | $310,000 | $40,000 | $270,000 |
| 2017 | $2,622 | $234,482 | $52,810 | $181,672 |
| 2016 | $2,597 | $229,885 | $51,775 | $178,110 |
| 2015 | $2,540 | $226,435 | $50,999 | $175,436 |
| 2014 | $1,974 | $178,284 | $47,132 | $131,152 |
Seller's Agent in 2018
Nolasco Blandon
Compass Real Estate
(951) 415-6161
7 in this area
146 Total Sales
Buyer's Agent in 2018
Michelle Williams
RE/MAX
(714) 423-6666
9 in this area
58 Total Sales
Buyer Co-Listing Agent in 2018
Shelly Larez
RE/MAX
(951) 847-5640
11 in this area
82 Total Sales
H
Seller's Agent in 2017
Harry Lee
Ace Union Investment
(909) 322-4185
5 Total Sales
P
Seller's Agent in 2014
Pete Nyiri
Top Producers Realty, Ryjen Group
(951) 529-6606
1 in this area
27 Total Sales
S
Buyer's Agent in 2014
Sydney Cho
Redpoint Realty
Source: California Regional Multiple Listing Service (CRMLS)
MLS Number: IG13229520
APN: 103-262-046
Disclaimer: Certain information contained herein is derived from information provided by parties other than Homes.com. All information provided is deemed reliable, but is not guaranteed to be accurate and should be independently verified.
![]() The multiple listing data appearing on this website, or contained in reports produced therefrom, is owned and copyrighted by California Regional Multiple Listing Service, Inc. ("CRMLS") and is protected by all applicable copyright laws. Information provided is for viewer's personal, non-commercial use and may not be used for any purpose other than to identify prospective properties the viewer may be interested in purchasing. All listing data, including but not limited to square footage and lot size is believed to be accurate, but the listing Agent, listing Broker and CRMLS and its affiliates do not warrant or guarantee such accuracy. The viewer should independently verify the listed data prior to making any decisions based on such information by personal inspection and/or contacting a real estate professional.
The multiple listing data appearing on this website, or contained in reports produced therefrom, is owned and copyrighted by California Regional Multiple Listing Service, Inc. ("CRMLS") and is protected by all applicable copyright laws. Information provided is for viewer's personal, non-commercial use and may not be used for any purpose other than to identify prospective properties the viewer may be interested in purchasing. All listing data, including but not limited to square footage and lot size is believed to be accurate, but the listing Agent, listing Broker and CRMLS and its affiliates do not warrant or guarantee such accuracy. The viewer should independently verify the listed data prior to making any decisions based on such information by personal inspection and/or contacting a real estate professional.
Based on information from California Regional Multiple Listing Service, Inc. and /or other sources. All data, including all measurements and calculations of area, is obtained from various sources and has not been, and will not be, verified by broker or MLS. All information should be independently reviewed and verified for accuracy. Properties may or may not be listed by the office/agent presenting the information