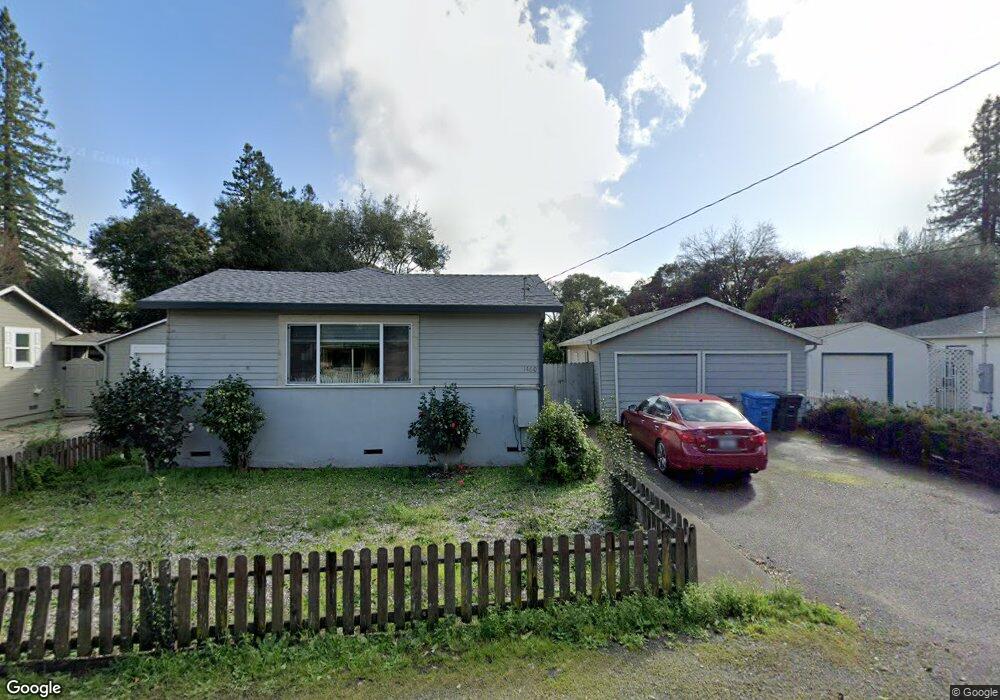
1091 Burbank Ave Santa Rosa, CA 95407
Estimated Value: $517,000 - $710,000
4
Beds
2
Baths
1,600
Sq Ft
$374/Sq Ft
Est. Value
About This Home
This home is located at 1091 Burbank Ave, Santa Rosa, CA 95407 and is currently estimated at $598,677, approximately $374 per square foot. 1091 Burbank Ave is a home located in Sonoma County with nearby schools including Elsie Allen High School and St. Michael's Orthodox School.
Ownership History
Date
Name
Owned For
Owner Type
Purchase Details
Closed on
Feb 7, 2024
Sold by
Baggett Rodney
Bought by
Rodney L Baggett Revocable Living Trust and Baggett
Current Estimated Value
Purchase Details
Closed on
Jul 30, 2010
Sold by
Pimentel Carolyn M and Pimentel Joseph
Bought by
Baggett Rodney
Home Financials for this Owner
Home Financials are based on the most recent Mortgage that was taken out on this home.
Original Mortgage
$123,750
Interest Rate
4.51%
Mortgage Type
New Conventional
Purchase Details
Closed on
Sep 2, 2009
Sold by
Arp Lisa L and Monty A Mcclane Revocable Trus
Bought by
Pimentel Carolyn M and Pimentel Joseph
Purchase Details
Closed on
Mar 5, 2007
Sold by
Mcclane Monty Allen
Bought by
Mcclane Monty A and Monty A Mcclane Revocable Trus
Create a Home Valuation Report for This Property
The Home Valuation Report is an in-depth analysis detailing your home's value as well as a comparison with similar homes in the area
Home Values in the Area
Average Home Value in this Area
Purchase History
| Date | Buyer | Sale Price | Title Company |
|---|---|---|---|
| Rodney L Baggett Revocable Living Trust | -- | None Listed On Document | |
| Baggett Rodney | $165,000 | First American Title Company | |
| Pimentel Carolyn M | -- | None Available | |
| Mcclane Monty A | -- | None Available |
Source: Public Records
Mortgage History
| Date | Status | Borrower | Loan Amount |
|---|---|---|---|
| Previous Owner | Baggett Rodney | $123,750 |
Source: Public Records
Tax History Compared to Growth
Tax History
| Year | Tax Paid | Tax Assessment Tax Assessment Total Assessment is a certain percentage of the fair market value that is determined by local assessors to be the total taxable value of land and additions on the property. | Land | Improvement |
|---|---|---|---|---|
| 2025 | $4,628 | $226,757 | $115,302 | $111,455 |
| 2024 | $4,628 | $222,312 | $113,042 | $109,270 |
| 2023 | $4,628 | $217,954 | $110,826 | $107,128 |
| 2022 | $4,395 | $213,681 | $108,653 | $105,028 |
| 2021 | $4,261 | $209,492 | $106,523 | $102,969 |
| 2020 | $4,276 | $207,345 | $105,431 | $101,914 |
| 2019 | $4,052 | $203,280 | $103,364 | $99,916 |
| 2018 | $3,978 | $199,295 | $101,338 | $97,957 |
| 2017 | $3,736 | $195,388 | $99,351 | $96,037 |
| 2016 | $3,662 | $191,557 | $97,403 | $94,154 |
| 2015 | -- | $188,680 | $95,940 | $92,740 |
| 2014 | -- | $184,985 | $94,061 | $90,924 |
Source: Public Records
Map
Nearby Homes
- 1521 Hughes Ave
- 59 Roundelay Ln
- 62 Romani Ct
- 70 Romani Ct
- 2006 Lazzini Ave
- 2002 Marble St
- 1538 Surrey Dr
- 534 E Jasmine Cir
- 0 West Ave Unit 325019616
- 576 E Jasmine Cir
- 628 Wisteria Ln
- 1953 Alamo Ln
- 1461 Trombetta St
- 733 Leo Dr
- 751 W Jasmine Cir Unit 3
- 1630 Mathwig Dr
- 2542 Buss Dr
- 780 Dutton Ave
- 2488 Giffen Ave
- 300 Stony Point Rd Unit 191
- 1524 Rose Ave
- 1460 Rose Ave
- 1093 Burbank Ave
- 1085 Burbank Ave
- 1448 Rose Ave
- 1097 Burbank Ave
- 1074 Lilac Dr
- 1570 Rose Ave
- 1442 Rose Ave
- 1027 Burbank Ave
- 1451 Hughes Ave
- 1473 Hughes Ave
- 1086 Lilac Dr
- 1425 Hughes Ave
- 1025 Burbank Ave
- 1497 Hughes Ave
- 1021 Burbank Ave
- 1098 Lilac Dr
- 1119 Burbank Ave
- 1455 Rose Ave