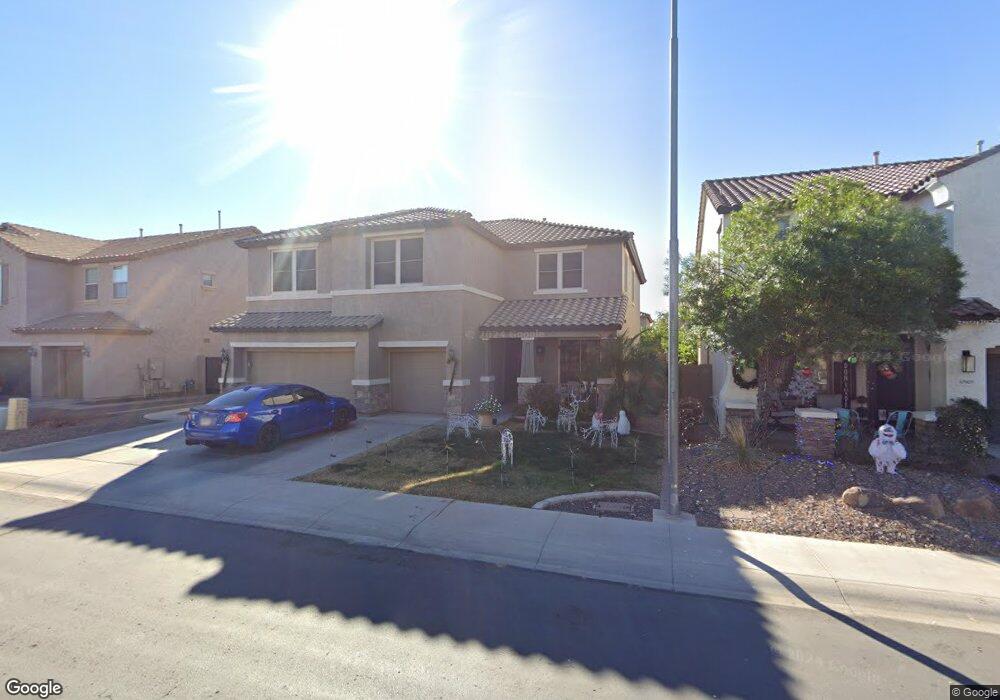
10913 E Stanton Ave Mesa, AZ 85212
Superstition Vistas NeighborhoodEstimated Value: $619,790 - $675,000
5
Beds
4
Baths
3,662
Sq Ft
$176/Sq Ft
Est. Value
About This Home
This home is located at 10913 E Stanton Ave, Mesa, AZ 85212 and is currently estimated at $646,198, approximately $176 per square foot. 10913 E Stanton Ave is a home located in Maricopa County with nearby schools including Gateway Polytechnic Academy, Eastmark High School, and Ala Mesa.
Ownership History
Date
Name
Owned For
Owner Type
Purchase Details
Closed on
Jun 12, 2020
Sold by
Ferguson Terresa M and Osborn Terresa M
Bought by
Osborn Terresa M and Eaker Robert W
Current Estimated Value
Home Financials for this Owner
Home Financials are based on the most recent Mortgage that was taken out on this home.
Original Mortgage
$265,000
Outstanding Balance
$234,902
Interest Rate
3.2%
Mortgage Type
New Conventional
Estimated Equity
$411,296
Purchase Details
Closed on
Feb 28, 2008
Sold by
Pulte Home Corp
Bought by
Ferguson Terresa M
Home Financials for this Owner
Home Financials are based on the most recent Mortgage that was taken out on this home.
Original Mortgage
$283,491
Interest Rate
5.64%
Mortgage Type
New Conventional
Create a Home Valuation Report for This Property
The Home Valuation Report is an in-depth analysis detailing your home's value as well as a comparison with similar homes in the area
Home Values in the Area
Average Home Value in this Area
Purchase History
| Date | Buyer | Sale Price | Title Company |
|---|---|---|---|
| Osborn Terresa M | -- | None Available | |
| Ferguson Terresa M | $314,990 | Sun Title Agency Co |
Source: Public Records
Mortgage History
| Date | Status | Borrower | Loan Amount |
|---|---|---|---|
| Open | Osborn Terresa M | $265,000 | |
| Closed | Ferguson Terresa M | $283,491 |
Source: Public Records
Tax History
| Year | Tax Paid | Tax Assessment Tax Assessment Total Assessment is a certain percentage of the fair market value that is determined by local assessors to be the total taxable value of land and additions on the property. | Land | Improvement |
|---|---|---|---|---|
| 2025 | $2,600 | $32,981 | -- | -- |
| 2024 | $2,801 | $31,410 | -- | -- |
| 2023 | $2,801 | $46,220 | $9,240 | $36,980 |
| 2022 | $2,699 | $35,220 | $7,040 | $28,180 |
| 2021 | $2,849 | $32,010 | $6,400 | $25,610 |
| 2020 | $2,757 | $31,170 | $6,230 | $24,940 |
| 2019 | $2,663 | $28,270 | $5,650 | $22,620 |
| 2018 | $2,525 | $27,130 | $5,420 | $21,710 |
| 2017 | $2,409 | $26,160 | $5,230 | $20,930 |
| 2016 | $2,406 | $26,160 | $5,230 | $20,930 |
| 2015 | $1,943 | $24,680 | $4,930 | $19,750 |
Source: Public Records
Map
Nearby Homes
- 4919 S Dante
- 10723 E Deawalter Ave
- 10726 E Sanger Ave
- 11106 E Serafina Ave
- 10707 E Lumiere Ave
- 10648 E Kinetic Dr
- 10718 E Lumiere Ave
- 4747 S Carmine Cir
- 10702 E Lumiere Ave
- 10831 E Sylvan Ave
- 4755 S Grenoble Cir
- 11137 E Sutter Ave
- 10704 E Hawk Ave
- 4620 S Hassett
- 4613 S Dante Cir
- 4610 S Hassett Cir
- 10636 E Stearn Ave
- 10702 E Sheffield Dr
- 10614 E Lincoln Ave
- 10535 E Diffraction Ave
- 10905 E Stanton Ave Unit 7
- 10921 E Stanton Ave
- 10914 E Sorpresa Ave
- 10929 E Stanton Ave
- 10865 E Stanton Ave Unit 7
- 10906 E Sorpresa Ave
- 10922 E Sorpresa Ave
- 10910 E Stanton Ave Unit 7
- 10866 E Sorpresa Ave
- 10930 E Sorpresa Ave
- 10918 E Stanton Ave Unit 7
- 10904 E Stanton Ave
- 10937 E Stanton Ave
- 10857 E Stanton Ave
- 10924 E Stanton Ave
- 10858 E Sorpresa Ave
- 10864 E Stanton Ave
- 10938 E Sorpresa Ave
- 10849 E Stanton Ave
- 10945 E Stanton Ave
Your Personal Tour Guide
Ask me questions while you tour the home.