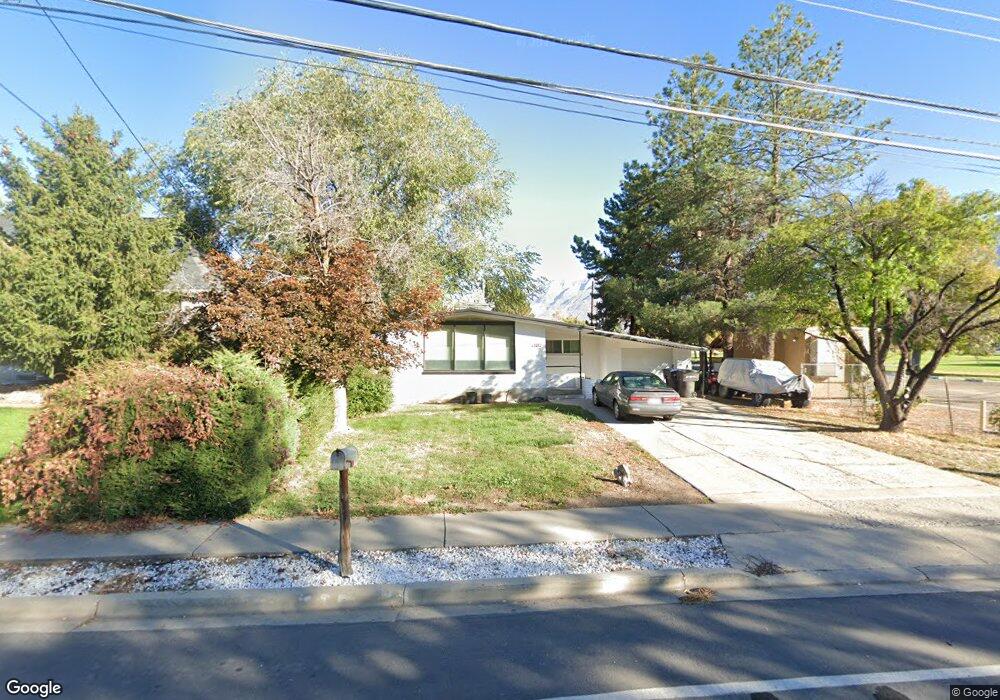
1092 W 1460 N Provo, UT 84604
Grandview North NeighborhoodEstimated Value: $496,000 - $559,000
4
Beds
2
Baths
1,188
Sq Ft
$447/Sq Ft
Est. Value
About This Home
This home is located at 1092 W 1460 N, Provo, UT 84604 and is currently estimated at $531,199, approximately $447 per square foot. 1092 W 1460 N is a home located in Utah County with nearby schools including Westridge Elementary School, Dixon Middle School, and Provo High School.
Ownership History
Date
Name
Owned For
Owner Type
Purchase Details
Closed on
Jan 31, 2018
Sold by
Carter Richard
Bought by
Carter Jessica D and Carter Richard
Current Estimated Value
Purchase Details
Closed on
Dec 22, 2016
Sold by
Dunn Michael R
Bought by
Carter Richard and Carter Jessica D
Home Financials for this Owner
Home Financials are based on the most recent Mortgage that was taken out on this home.
Original Mortgage
$214,577
Outstanding Balance
$174,486
Interest Rate
3.75%
Mortgage Type
FHA
Estimated Equity
$356,713
Purchase Details
Closed on
Nov 23, 2016
Sold by
Dunn Michael R and Dunn Michael R
Bought by
Dunn Michael R
Home Financials for this Owner
Home Financials are based on the most recent Mortgage that was taken out on this home.
Original Mortgage
$214,577
Outstanding Balance
$174,486
Interest Rate
3.75%
Mortgage Type
FHA
Estimated Equity
$356,713
Purchase Details
Closed on
Oct 25, 2015
Sold by
Dunn Roy Penrose
Bought by
Dunn Mitchael R
Create a Home Valuation Report for This Property
The Home Valuation Report is an in-depth analysis detailing your home's value as well as a comparison with similar homes in the area
Home Values in the Area
Average Home Value in this Area
Purchase History
| Date | Buyer | Sale Price | Title Company |
|---|---|---|---|
| Carter Jessica D | -- | North American Title | |
| Carter Richard | -- | North American Title | |
| Carter Richard | -- | First American Title | |
| Dunn Michael R | -- | First American | |
| Dunn Mitchael R | -- | None Available |
Source: Public Records
Mortgage History
| Date | Status | Borrower | Loan Amount |
|---|---|---|---|
| Open | Carter Richard | $214,577 |
Source: Public Records
Tax History Compared to Growth
Tax History
| Year | Tax Paid | Tax Assessment Tax Assessment Total Assessment is a certain percentage of the fair market value that is determined by local assessors to be the total taxable value of land and additions on the property. | Land | Improvement |
|---|---|---|---|---|
| 2025 | $2,638 | $286,990 | $218,400 | $303,400 |
| 2024 | $2,638 | $259,655 | $0 | $0 |
| 2023 | $2,664 | $258,500 | $0 | $0 |
| 2022 | $2,592 | $253,605 | $0 | $0 |
| 2021 | $1,853 | $316,200 | $123,200 | $193,000 |
| 2020 | $1,787 | $285,900 | $112,000 | $173,900 |
| 2019 | $1,706 | $283,900 | $112,000 | $171,900 |
| 2018 | $1,492 | $251,700 | $102,200 | $149,500 |
| 2017 | $1,435 | $133,045 | $0 | $0 |
| 2016 | $1,483 | $128,150 | $0 | $0 |
| 2015 | $1,467 | $128,150 | $0 | $0 |
| 2014 | $1,230 | $112,035 | $0 | $0 |
Source: Public Records
Map
Nearby Homes
- 1430 N 1160 W
- 1188 W 1380 N
- 1525 N 1250 W
- 1250 Jordan Ave
- 920 W Columbia Ln
- 1633 Woodland Dr
- 1375 W 1460 N
- 1685 Hickory Ln
- 1763 Willowbrook Dr Unit 4D1
- 1661 Willowbrook Dr
- 1254 N 800 W
- 1471 W 1460 N
- 1149 N 850 W
- 1009 W 2000 N
- 1559 N Riverside Ave Unit 4
- 493 E 2000 S
- 1516 W 1970 N
- 1620 W 1000 N
- 1927 Columbia Ln
- 819 W 2300 N