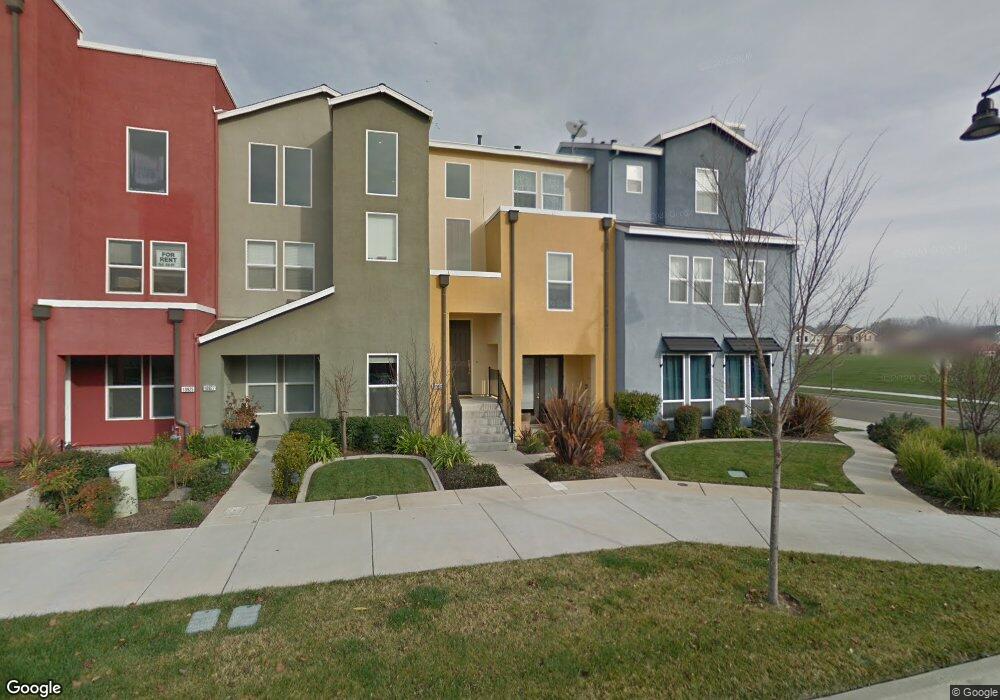
10929 Tower Park Dr Rancho Cordova, CA 95670
Capital Village NeighborhoodEstimated Value: $394,000 - $469,223
2
Beds
5
Baths
1,495
Sq Ft
$296/Sq Ft
Est. Value
About This Home
This home is located at 10929 Tower Park Dr, Rancho Cordova, CA 95670 and is currently estimated at $442,556, approximately $296 per square foot. 10929 Tower Park Dr is a home located in Sacramento County with nearby schools including Navigator Elementary School, W.E. Mitchell Middle School, and Cordova High School.
Ownership History
Date
Name
Owned For
Owner Type
Purchase Details
Closed on
Apr 27, 2007
Sold by
Beazer Homes Holdings Corp
Bought by
Markis Carrie A
Current Estimated Value
Home Financials for this Owner
Home Financials are based on the most recent Mortgage that was taken out on this home.
Original Mortgage
$251,550
Interest Rate
6.74%
Mortgage Type
Purchase Money Mortgage
Create a Home Valuation Report for This Property
The Home Valuation Report is an in-depth analysis detailing your home's value as well as a comparison with similar homes in the area
Home Values in the Area
Average Home Value in this Area
Purchase History
| Date | Buyer | Sale Price | Title Company |
|---|---|---|---|
| Markis Carrie A | $280,000 | Chicago Title Co |
Source: Public Records
Mortgage History
| Date | Status | Borrower | Loan Amount |
|---|---|---|---|
| Previous Owner | Markis Carrie A | $251,550 |
Source: Public Records
Tax History Compared to Growth
Tax History
| Year | Tax Paid | Tax Assessment Tax Assessment Total Assessment is a certain percentage of the fair market value that is determined by local assessors to be the total taxable value of land and additions on the property. | Land | Improvement |
|---|---|---|---|---|
| 2025 | $5,597 | $367,144 | $197,022 | $170,122 |
| 2024 | $5,597 | $359,946 | $193,159 | $166,787 |
| 2023 | $5,436 | $352,889 | $189,372 | $163,517 |
| 2022 | $5,308 | $345,970 | $185,659 | $160,311 |
| 2021 | $5,191 | $339,187 | $182,019 | $157,168 |
| 2020 | $5,142 | $335,710 | $180,153 | $155,557 |
| 2019 | $4,834 | $310,895 | $166,835 | $144,060 |
| 2018 | $4,639 | $298,939 | $160,419 | $138,520 |
| 2017 | $4,317 | $276,797 | $148,537 | $128,260 |
| 2016 | $4,130 | $261,130 | $140,130 | $121,000 |
| 2015 | $3,831 | $246,350 | $132,199 | $114,151 |
| 2014 | $3,913 | $234,619 | $125,904 | $108,715 |
Source: Public Records
Map
Nearby Homes
- 10854 Atherstone Dr
- 11021 International Dr
- 10884 Stourport Way
- 11076 International Dr
- 3215 Bridgeway Dr
- 3247 Foxton Way
- 3216 Bridgeway Dr
- 10969 Pelara Way
- 10851 Arrington Dr
- 3316 Corvina Dr
- 3314 Brolio Ct
- 2724 Zinfandel Dr
- 3412 Muscat Way
- 10884 Windrow Way
- 10907 Bushel Way
- 10880 Windrow Way
- 10810 Paiute Way
- 10929 Bushel Way
- 10927 Bushel Way
- 10916 Bushel Way
- 10927 Tower Park Dr
- 10931 Tower Park Dr
- 10925 Tower Park Dr
- 10923 Tower Park Dr
- 10921 Tower Park Dr
- 3124 Mowbray Way
- 3129 Lea Sterling Way
- 3122 Mowbray Way
- 3127 Lea Sterling Way
- 10926 Tower Park Dr
- 10922 Tower Park Dr
- 3120 Mowbray Way
- 10930 Tower Park Dr
- 10928 Tower Park Dr
- 10924 Tower Park Dr
- 3125 Lea Sterling Way
- 10917 Tower Park Dr
- 10920 Tower Park Dr
- 3118 Mowbray Way
- 10938 Tower Park Dr