1093 460th Ave Sabula, IA 52070
Estimated Value: $265,000 - $296,161
3
Beds
2
Baths
1,392
Sq Ft
$202/Sq Ft
Est. Value
About This Home
This home is located at 1093 460th Ave, Sabula, IA 52070 and is currently estimated at $280,540, approximately $201 per square foot. 1093 460th Ave is a home located in Clinton County with nearby schools including Easton Valley Elementary School and Easton Valley Middle & High School.
Ownership History
Date
Name
Owned For
Owner Type
Purchase Details
Closed on
Sep 10, 2014
Sold by
Snyder Dianne and Snyder Dianne L
Bought by
Snyder Shannon
Current Estimated Value
Home Financials for this Owner
Home Financials are based on the most recent Mortgage that was taken out on this home.
Original Mortgage
$166,250
Interest Rate
4.11%
Mortgage Type
Unknown
Purchase Details
Closed on
Jan 9, 2014
Sold by
Estate Of Robin L Snyder
Bought by
Snyder Dianne L
Create a Home Valuation Report for This Property
The Home Valuation Report is an in-depth analysis detailing your home's value as well as a comparison with similar homes in the area
Home Values in the Area
Average Home Value in this Area
Purchase History
| Date | Buyer | Sale Price | Title Company |
|---|---|---|---|
| Snyder Shannon | -- | None Available | |
| Snyder Dianne L | -- | None Available |
Source: Public Records
Mortgage History
| Date | Status | Borrower | Loan Amount |
|---|---|---|---|
| Open | Snyder Shannon | $143,500 | |
| Closed | Snyder Shannon | $166,250 |
Source: Public Records
Tax History Compared to Growth
Tax History
| Year | Tax Paid | Tax Assessment Tax Assessment Total Assessment is a certain percentage of the fair market value that is determined by local assessors to be the total taxable value of land and additions on the property. | Land | Improvement |
|---|---|---|---|---|
| 2024 | $2,794 | $228,740 | $68,960 | $159,780 |
| 2023 | $2,794 | $228,740 | $68,960 | $159,780 |
| 2022 | $2,390 | $218,100 | $68,960 | $149,140 |
| 2021 | $2,388 | $160,300 | $32,120 | $128,180 |
| 2020 | $2,388 | $154,200 | $32,120 | $122,080 |
| 2019 | $2,700 | $172,650 | $0 | $0 |
| 2018 | $2,430 | $172,650 | $0 | $0 |
| 2017 | $1,936 | $134,000 | $0 | $0 |
| 2016 | $1,918 | $134,000 | $0 | $0 |
| 2015 | $1,918 | $122,870 | $0 | $0 |
| 2014 | $1,666 | $122,870 | $0 | $0 |
| 2013 | $1,556 | $0 | $0 | $0 |
Source: Public Records
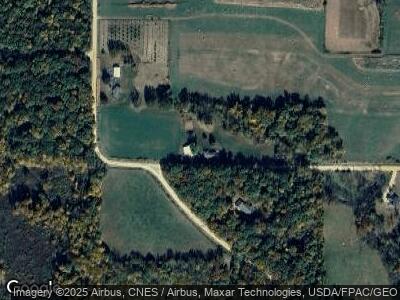
Map
Nearby Homes