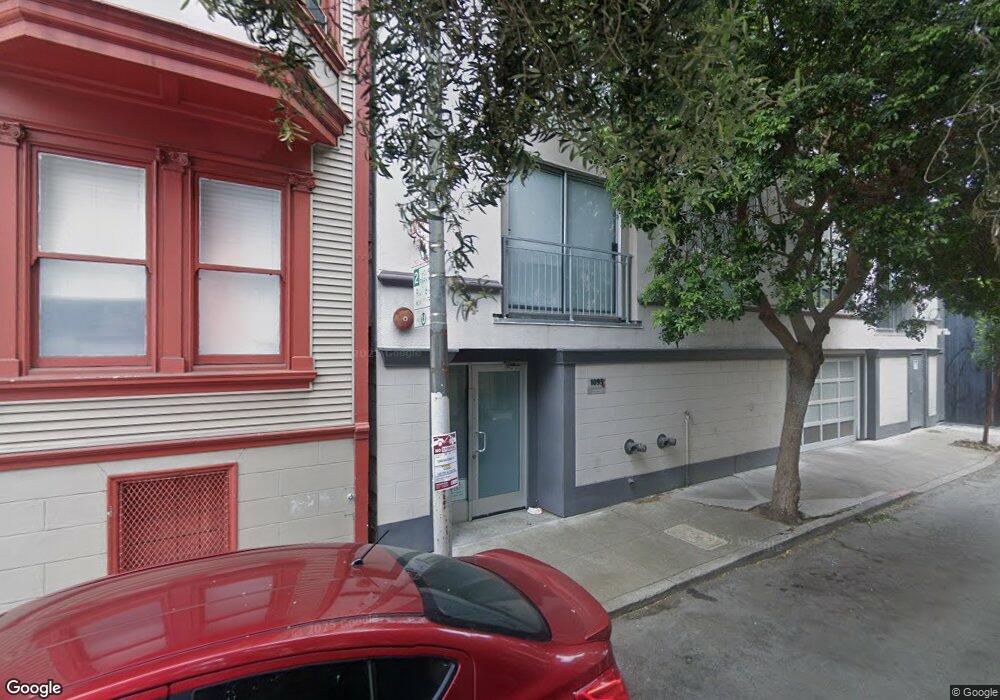
1095 Natoma St Unit 5 San Francisco, CA 94103
South of Market NeighborhoodEstimated Value: $573,000 - $930,000
2
Beds
2
Baths
991
Sq Ft
$779/Sq Ft
Est. Value
About This Home
This home is located at 1095 Natoma St Unit 5, San Francisco, CA 94103 and is currently estimated at $771,807, approximately $778 per square foot. 1095 Natoma St Unit 5 is a home located in San Francisco County with nearby schools including Daniel Webster Elementary School, James Lick Middle School, and Presidio Knolls School.
Ownership History
Date
Name
Owned For
Owner Type
Purchase Details
Closed on
Apr 5, 2006
Sold by
Habermeier Bernt and Habermeier Molly
Bought by
Quezada Jose H
Current Estimated Value
Home Financials for this Owner
Home Financials are based on the most recent Mortgage that was taken out on this home.
Original Mortgage
$98,250
Outstanding Balance
$55,938
Interest Rate
6.2%
Mortgage Type
Unknown
Estimated Equity
$715,869
Purchase Details
Closed on
Sep 4, 2002
Sold by
Spafford Christopher M and Spafford Ginny C
Bought by
Habermeier Bernt and Mccarty Molly
Home Financials for this Owner
Home Financials are based on the most recent Mortgage that was taken out on this home.
Original Mortgage
$435,625
Interest Rate
5.87%
Purchase Details
Closed on
Feb 28, 2000
Sold by
1095 Natoma Street Llc
Bought by
Spafford Christopher M and Spafford Ginny C
Home Financials for this Owner
Home Financials are based on the most recent Mortgage that was taken out on this home.
Original Mortgage
$378,000
Interest Rate
7.25%
Create a Home Valuation Report for This Property
The Home Valuation Report is an in-depth analysis detailing your home's value as well as a comparison with similar homes in the area
Home Values in the Area
Average Home Value in this Area
Purchase History
| Date | Buyer | Sale Price | Title Company |
|---|---|---|---|
| Quezada Jose H | $655,000 | Fidelity National Title Co | |
| Habermeier Bernt | $512,500 | Old Republic Title Company | |
| Spafford Christopher M | $505,000 | First American Title Co |
Source: Public Records
Mortgage History
| Date | Status | Borrower | Loan Amount |
|---|---|---|---|
| Open | Quezada Jose H | $98,250 | |
| Open | Quezada Jose H | $524,000 | |
| Previous Owner | Habermeier Bernt | $435,625 | |
| Previous Owner | Spafford Christopher M | $378,000 | |
| Closed | Spafford Christopher M | $25,200 |
Source: Public Records
Tax History Compared to Growth
Tax History
| Year | Tax Paid | Tax Assessment Tax Assessment Total Assessment is a certain percentage of the fair market value that is determined by local assessors to be the total taxable value of land and additions on the property. | Land | Improvement |
|---|---|---|---|---|
| 2025 | $11,325 | $895,096 | $447,548 | $447,548 |
| 2024 | $11,325 | $877,546 | $438,773 | $438,773 |
| 2023 | $11,118 | $860,340 | $430,170 | $430,170 |
| 2022 | $10,889 | $843,472 | $421,736 | $421,736 |
| 2021 | $10,681 | $826,934 | $413,467 | $413,467 |
| 2020 | $10,730 | $818,456 | $409,228 | $409,228 |
| 2019 | $10,366 | $802,408 | $401,204 | $401,204 |
| 2018 | $9,807 | $786,676 | $393,338 | $393,338 |
| 2017 | $9,392 | $771,252 | $385,626 | $385,626 |
| 2016 | $9,227 | $756,130 | $378,065 | $378,065 |
| 2015 | $9,111 | $744,774 | $372,387 | $372,387 |
| 2014 | $8,871 | $730,186 | $365,093 | $365,093 |
Source: Public Records
Map
Nearby Homes
- 1035 Natoma St
- 1532 Howard St Unit 203
- 1532 Howard St Unit 202
- 140 S Van Ness Ave Unit 704
- 140 S Van Ness Ave Unit 430
- 1586 Folsom St
- 1608 Folsom St
- 301 11th St Unit 2B
- 1400 Mission St Unit 709
- 1400 Mission St Unit 1203
- 1400 Mission St Unit 1303
- 49 Norfolk St
- 241 10th St Unit 305
- 9 Grace St
- 9 Bernice St
- 252 9th St Unit 501
- 55 Page St Unit 514
- 55 Page St Unit 219
- 77 Van Ness Ave Unit 605
- 135 Dore St
- 1095 Natoma St Unit 4
- 1095 Natoma St Unit 1
- 1095 Natoma St Unit 8
- 1096 Natoma St Unit IT
- 1095 Natoma St Unit IT1
- 1095 Natoma St Unit 2
- 1095 Natoma St Unit 7
- 1095 Natoma St Unit 3
- 1095 Natoma St Unit 6
- 1077 Natoma St
- 1071 Natoma St
- 1071A Natoma St
- 1073 Natoma St
- 1566 Howard St
- 1570 Howard St
- 1572 Howard St
- 1067 Natoma St
- 1065 Natoma St
- 66 Lafayette St
- 1556 Howard St Unit A