K
Seller's Agent in 2024
Kelley And Katzer Team
Kelley & Katzer Real Estate, LLC
(413) 530-8828
3 in this area
743 Total Sales

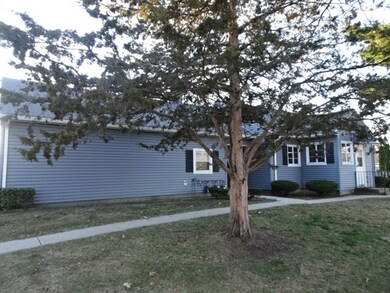
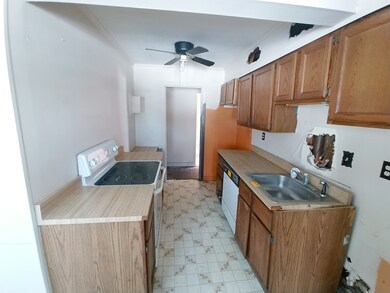
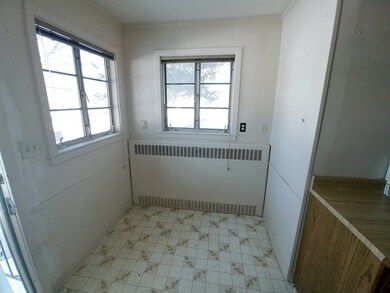
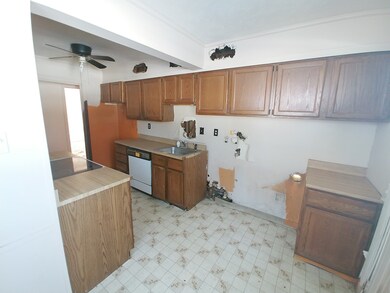

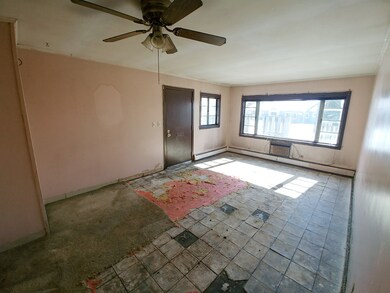
Come check out this Garden style condo featuring 4 rooms, 2 bedrooms and 1 bathroom. Plus a 1 car grage. Bring your ideas and make this home your own. Buyer to verify all info and use.
| Date | Type | Sale Price | Title Company |
|---|---|---|---|
| Deed | $220,000 | None Available | |
| Deed | $220,000 | None Available | |
| Not Resolvable | $175,000 | None Available | |
| Not Resolvable | $125,000 | None Available | |
| Not Resolvable | $55,279 | None Available | |
| Not Resolvable | $75,000 | -- | |
| Not Resolvable | $55,279 | -- | |
| Foreclosure Deed | $76,000 | -- | |
| Foreclosure Deed | $76,000 | -- | |
| Deed | $111,000 | -- | |
| Deed | $111,000 | -- | |
| Deed | $88,500 | -- | |
| Deed | $88,500 | -- | |
| Deed | $65,000 | -- | |
| Deed | $65,000 | -- |
| Date | Status | Loan Amount | Loan Type |
|---|---|---|---|
| Open | $209,000 | Purchase Money Mortgage | |
| Closed | $209,000 | Purchase Money Mortgage | |
| Previous Owner | $161,500 | Purchase Money Mortgage | |
| Previous Owner | $19,000 | Second Mortgage Made To Cover Down Payment | |
| Previous Owner | $171,830 | FHA | |
| Previous Owner | $109,285 | Purchase Money Mortgage | |
| Previous Owner | $85,845 | Purchase Money Mortgage |
| Date | Event | Price | Change | Sq Ft Price |
|---|---|---|---|---|
| 04/26/2024 04/26/24 | Sold | $220,000 | +10.1% | $297 / Sq Ft |
| 03/18/2024 03/18/24 | Pending | -- | -- | -- |
| 03/12/2024 03/12/24 | For Sale | $199,900 | 0.0% | $270 / Sq Ft |
| 03/09/2024 03/09/24 | Pending | -- | -- | -- |
| 03/06/2024 03/06/24 | For Sale | $199,900 | +5.2% | $270 / Sq Ft |
| 12/14/2022 12/14/22 | Sold | $190,000 | -4.0% | $257 / Sq Ft |
| 10/28/2022 10/28/22 | Pending | -- | -- | -- |
| 09/12/2022 09/12/22 | Price Changed | $198,000 | -2.9% | $268 / Sq Ft |
| 08/30/2022 08/30/22 | Price Changed | $204,000 | -4.7% | $276 / Sq Ft |
| 08/16/2022 08/16/22 | For Sale | $214,000 | +22.3% | $289 / Sq Ft |
| 12/15/2021 12/15/21 | Sold | $175,000 | +16.7% | $236 / Sq Ft |
| 11/08/2021 11/08/21 | Pending | -- | -- | -- |
| 11/02/2021 11/02/21 | For Sale | $150,000 | +20.0% | $203 / Sq Ft |
| 02/14/2020 02/14/20 | Sold | $125,000 | -3.8% | $169 / Sq Ft |
| 01/17/2020 01/17/20 | Pending | -- | -- | -- |
| 12/21/2019 12/21/19 | For Sale | $129,900 | 0.0% | $176 / Sq Ft |
| 12/16/2019 12/16/19 | Pending | -- | -- | -- |
| 12/11/2019 12/11/19 | Price Changed | $129,900 | -3.7% | $176 / Sq Ft |
| 11/06/2019 11/06/19 | Price Changed | $134,900 | -3.6% | $182 / Sq Ft |
| 10/30/2019 10/30/19 | For Sale | $139,900 | +86.5% | $189 / Sq Ft |
| 09/20/2019 09/20/19 | Sold | $75,000 | -6.1% | $101 / Sq Ft |
| 08/16/2019 08/16/19 | Pending | -- | -- | -- |
| 06/16/2019 06/16/19 | For Sale | $79,900 | 0.0% | $108 / Sq Ft |
| 06/12/2019 06/12/19 | Pending | -- | -- | -- |
| 05/16/2019 05/16/19 | For Sale | $79,900 | 0.0% | $108 / Sq Ft |
| 03/28/2019 03/28/19 | Pending | -- | -- | -- |
| 03/01/2019 03/01/19 | For Sale | $79,900 | -- | $108 / Sq Ft |
| Year | Tax Paid | Tax Assessment Tax Assessment Total Assessment is a certain percentage of the fair market value that is determined by local assessors to be the total taxable value of land and additions on the property. | Land | Improvement |
|---|---|---|---|---|
| 2025 | $2,347 | $154,800 | $0 | $154,800 |
| 2024 | $2,106 | $142,700 | $0 | $142,700 |
| 2023 | $2,380 | $157,100 | $0 | $157,100 |
| 2022 | $2,010 | $118,300 | $0 | $118,300 |
| 2021 | $1,916 | $108,800 | $0 | $108,800 |
| 2020 | $1,706 | $97,700 | $0 | $97,700 |
| 2019 | $2,044 | $113,800 | $0 | $113,800 |
| 2018 | $1,631 | $89,100 | $0 | $89,100 |
| 2017 | $1,515 | $87,500 | $0 | $87,500 |
| 2016 | $1,500 | $88,700 | $0 | $88,700 |
| 2015 | $1,556 | $88,700 | $0 | $88,700 |
| 2014 | $778 | $88,700 | $0 | $88,700 |
K
Seller's Agent in 2024
Kelley And Katzer Team
Kelley & Katzer Real Estate, LLC
(413) 530-8828
3 in this area
743 Total Sales

Seller Co-Listing Agent in 2024
Joseph Kelley
Kelley & Katzer Real Estate, LLC
(413) 519-0617
3 in this area
743 Total Sales
Buyer's Agent in 2024
Kristin Trytko
Canon Real Estate, Inc.
(413) 244-8720
1 in this area
42 Total Sales
L
Seller's Agent in 2022
Lori Walder
RE/MAX
T
Buyer's Agent in 2022
Tyler Ziemba
Lock and Key Realty Inc.
Seller's Agent in 2021
The Tracy Gagne Realty Group
eXp Realty
(413) 219-4225
4 in this area
276 Total Sales
Source: MLS Property Information Network (MLS PIN)
MLS Number: 72459453
APN: CHIC-000001-000000-W006045D
Disclaimer: Certain information contained herein is derived from information provided by parties other than Homes.com. All information provided is deemed reliable, but is not guaranteed to be accurate and should be independently verified.
![]() The property listing data and information, or the Images, set forth herein were provided to MLS Property Information Network, Inc. from third party sources, including sellers, lessors and public records, and were compiled by MLS Property Information Network, Inc. The property listing data and information, and the Images, are for the personal, non-commercial use of consumers having a good faith interest in purchasing or leasing listed properties of the type displayed to them and may not be used for any purpose other than to identify prospective properties which such consumers may have a good faith interest in purchasing or leasing. MLS Property Information Network, Inc. and its subscribers disclaim any and all representations and warranties as to the accuracy of the property listing data and information, or as to the accuracy of any of the Images, set forth herein.
The property listing data and information, or the Images, set forth herein were provided to MLS Property Information Network, Inc. from third party sources, including sellers, lessors and public records, and were compiled by MLS Property Information Network, Inc. The property listing data and information, and the Images, are for the personal, non-commercial use of consumers having a good faith interest in purchasing or leasing listed properties of the type displayed to them and may not be used for any purpose other than to identify prospective properties which such consumers may have a good faith interest in purchasing or leasing. MLS Property Information Network, Inc. and its subscribers disclaim any and all representations and warranties as to the accuracy of the property listing data and information, or as to the accuracy of any of the Images, set forth herein.