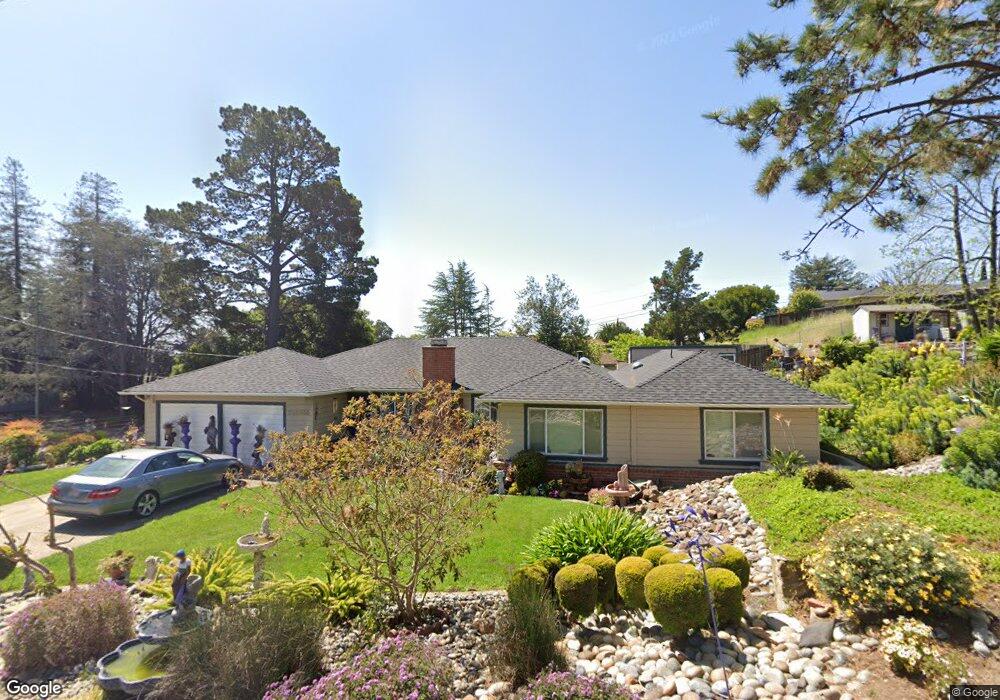
10955 Ettrick St Oakland, CA 94605
Chabot Park NeighborhoodEstimated Value: $987,000 - $1,310,000
4
Beds
2
Baths
1,949
Sq Ft
$583/Sq Ft
Est. Value
About This Home
This home is located at 10955 Ettrick St, Oakland, CA 94605 and is currently estimated at $1,137,003, approximately $583 per square foot. 10955 Ettrick St is a home located in Alameda County with nearby schools including Grass Valley Elementary School, Elmhurst United Middle School, and Skyline High School.
Ownership History
Date
Name
Owned For
Owner Type
Purchase Details
Closed on
May 23, 2018
Sold by
Jefferson Loretta D and Ross Loretta D
Bought by
Jefferson Loretta D and Loretta D Ross Family Trust
Current Estimated Value
Home Financials for this Owner
Home Financials are based on the most recent Mortgage that was taken out on this home.
Original Mortgage
$504,000
Outstanding Balance
$434,956
Interest Rate
4.5%
Mortgage Type
New Conventional
Estimated Equity
$702,047
Purchase Details
Closed on
Mar 14, 2015
Sold by
Alimayu Chris K
Bought by
Jefferson Loretta D and Loretta D Ross Family Trust
Purchase Details
Closed on
Jul 23, 2003
Sold by
Ross Loretta D
Bought by
Ross Loretta D and The Loretta D Ross Family Trus
Purchase Details
Closed on
Jul 11, 2002
Sold by
Ross Allum
Bought by
Ross Loretta D
Home Financials for this Owner
Home Financials are based on the most recent Mortgage that was taken out on this home.
Original Mortgage
$232,000
Interest Rate
6.6%
Create a Home Valuation Report for This Property
The Home Valuation Report is an in-depth analysis detailing your home's value as well as a comparison with similar homes in the area
Home Values in the Area
Average Home Value in this Area
Purchase History
| Date | Buyer | Sale Price | Title Company |
|---|---|---|---|
| Jefferson Loretta D | -- | Placer Title Company | |
| Jefferson Loretta D | -- | None Available | |
| Ross Loretta D | -- | -- | |
| Ross Loretta D | -- | First American Title |
Source: Public Records
Mortgage History
| Date | Status | Borrower | Loan Amount |
|---|---|---|---|
| Open | Jefferson Loretta D | $504,000 | |
| Previous Owner | Ross Loretta D | $232,000 | |
| Closed | Ross Loretta D | $100,000 |
Source: Public Records
Tax History Compared to Growth
Tax History
| Year | Tax Paid | Tax Assessment Tax Assessment Total Assessment is a certain percentage of the fair market value that is determined by local assessors to be the total taxable value of land and additions on the property. | Land | Improvement |
|---|---|---|---|---|
| 2025 | $6,545 | $349,464 | $121,043 | $228,421 |
| 2024 | $6,545 | $342,612 | $118,670 | $223,942 |
| 2023 | $6,756 | $335,894 | $116,343 | $219,551 |
| 2022 | $6,524 | $329,309 | $114,062 | $215,247 |
| 2021 | $6,531 | $322,853 | $111,826 | $211,027 |
| 2020 | $6,085 | $319,542 | $110,679 | $208,863 |
| 2019 | $5,807 | $313,277 | $108,509 | $204,768 |
| 2018 | $5,676 | $307,136 | $106,382 | $200,754 |
| 2017 | $5,439 | $301,115 | $104,297 | $196,818 |
| 2016 | $5,357 | $295,211 | $102,252 | $192,959 |
| 2015 | $5,171 | $290,777 | $100,716 | $190,061 |
| 2014 | $4,944 | $285,081 | $98,743 | $186,338 |
Source: Public Records
Map
Nearby Homes
- 11201 Lochard St
- 10838 Monan St
- 11320 Lochard St
- 0 Lochard St Unit 41113902
- 11388 Lochard St
- 10910 Glen Artney St
- 4847 Dunkirk Ave
- 9 Leamont Ct
- 11275 Kerrigan Dr
- 25 Woodcliff Ct
- 10492 Royal Oak Rd
- 10353 Royal Oak Rd
- 10317 Royal Oak Rd
- 3818-3818A Northridge Ave
- 3910 Oak Hill Rd
- 142 Sequoyah View Dr
- 10768 Sheldon St
- 85 Sequoyah View Dr
- 2 Sequoyah View Dr
- 3247 Revere Ave
- 10935 Ettrick St
- 4303 Aberfoil Ave
- 10950 Lochard St
- 10921 Ettrick St
- 4361 Aberfoil Ave
- 10950 Ettrick St
- 11011 Ettrick St
- 4356 Aberfoil Ave
- 4300 Aberfoil Ave
- 10879 Ettrick St
- 10951 Lochard St
- 10900 Lochard St
- 10995 Elvessa St
- 10880 Ettrick St
- 10931 Lochard St
- 10985 Elvessa St
- 11001 Lochard St
- 4225 Aberfoil Ave
- 4380 Aberfoil Ave
- 10919 Lochard St