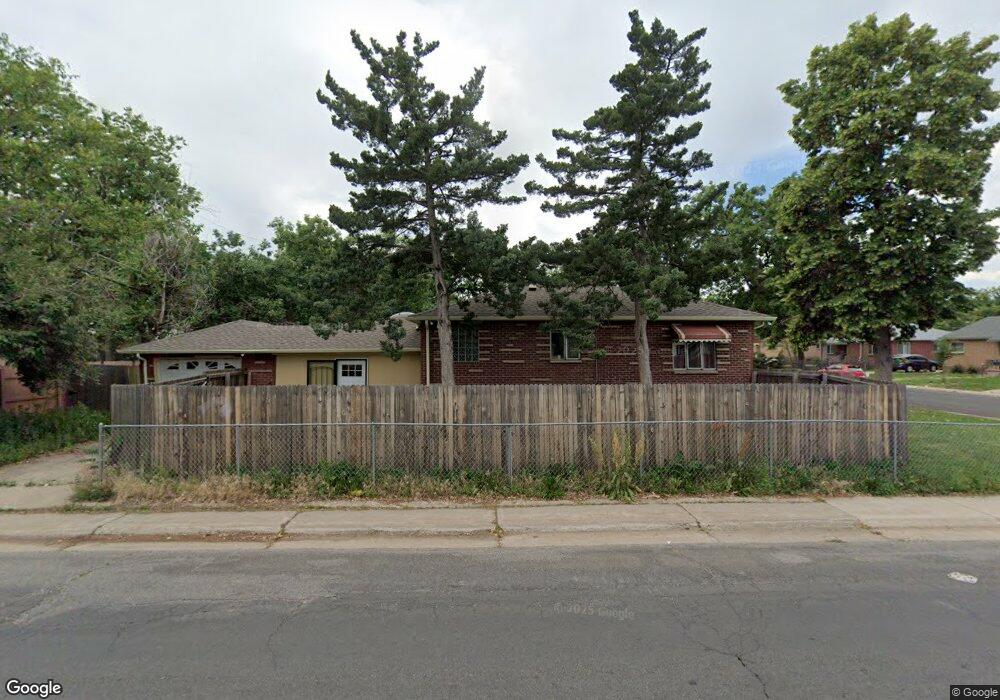
1096 Lansing St Aurora, CO 80010
Del Mar Parkway NeighborhoodEstimated Value: $433,000 - $484,000
3
Beds
2
Baths
2,542
Sq Ft
$181/Sq Ft
Est. Value
About This Home
This home is located at 1096 Lansing St, Aurora, CO 80010 and is currently estimated at $460,927, approximately $181 per square foot. 1096 Lansing St is a home located in Arapahoe County with nearby schools including Kenton Elementary School, Sunnydale Elementary School, and Lincoln Elementary School.
Ownership History
Date
Name
Owned For
Owner Type
Purchase Details
Closed on
Apr 13, 2021
Sold by
Ta Saw Pow and Mana Thang
Bought by
Ta Saw Pow and Saw Naw Ghay
Current Estimated Value
Home Financials for this Owner
Home Financials are based on the most recent Mortgage that was taken out on this home.
Original Mortgage
$299,000
Outstanding Balance
$270,177
Interest Rate
3.05%
Mortgage Type
New Conventional
Estimated Equity
$190,750
Purchase Details
Closed on
Jun 28, 2018
Sold by
Hung Naing Boi and Hung Thang
Bought by
Ta Michigan Pow and Mana Thang
Home Financials for this Owner
Home Financials are based on the most recent Mortgage that was taken out on this home.
Original Mortgage
$304,000
Interest Rate
4.6%
Mortgage Type
New Conventional
Purchase Details
Closed on
Aug 28, 2015
Sold by
Stewart Emmett Keith and Stewart Nancy Jan
Bought by
Naing Boi and Aung Hung Thang
Home Financials for this Owner
Home Financials are based on the most recent Mortgage that was taken out on this home.
Original Mortgage
$248,417
Interest Rate
4.4%
Mortgage Type
FHA
Purchase Details
Closed on
Jul 22, 2004
Sold by
Masshoff E Gary
Bought by
Stewart Emmett Keith and Stewart Nancy Jan
Home Financials for this Owner
Home Financials are based on the most recent Mortgage that was taken out on this home.
Original Mortgage
$144,000
Interest Rate
6.32%
Mortgage Type
Purchase Money Mortgage
Purchase Details
Closed on
Apr 30, 1996
Sold by
Kraich Chris J and Kraich Darlene F
Bought by
Masshoff E Gary
Home Financials for this Owner
Home Financials are based on the most recent Mortgage that was taken out on this home.
Original Mortgage
$89,264
Interest Rate
7.8%
Mortgage Type
FHA
Purchase Details
Closed on
May 4, 1993
Sold by
Secretary Of Housing & Urban Dev
Bought by
Kraich Chris J and Kraich Darlene F
Purchase Details
Closed on
Jan 4, 1993
Sold by
Chonsoongnern Twatchai and Chonsoongnern Chailai
Bought by
Secretary Of Housing & Urban Dev
Purchase Details
Closed on
Dec 1, 1989
Sold by
Conversion Arapco
Bought by
Chonsoongnern Twatchai and Chonsoongnern Chailai
Purchase Details
Closed on
Jul 4, 1776
Bought by
Conversion Arapco
Create a Home Valuation Report for This Property
The Home Valuation Report is an in-depth analysis detailing your home's value as well as a comparison with similar homes in the area
Home Values in the Area
Average Home Value in this Area
Purchase History
| Date | Buyer | Sale Price | Title Company |
|---|---|---|---|
| Ta Saw Pow | -- | Land Title Guarantee | |
| Ta Michigan Pow | $320,000 | None Available | |
| Naing Boi | $258,000 | Stewart Title | |
| Stewart Emmett Keith | $180,000 | Fahtco | |
| Masshoff E Gary | $96,000 | -- | |
| Kraich Chris J | -- | -- | |
| Secretary Of Housing & Urban Dev | -- | -- | |
| Chonsoongnern Twatchai | -- | -- | |
| Conversion Arapco | -- | -- |
Source: Public Records
Mortgage History
| Date | Status | Borrower | Loan Amount |
|---|---|---|---|
| Open | Ta Saw Pow | $299,000 | |
| Closed | Ta Michigan Pow | $304,000 | |
| Previous Owner | Naing Boi | $248,417 | |
| Previous Owner | Stewart Emmett Keith | $144,000 | |
| Previous Owner | Masshoff E Gary | $89,264 |
Source: Public Records
Tax History Compared to Growth
Tax History
| Year | Tax Paid | Tax Assessment Tax Assessment Total Assessment is a certain percentage of the fair market value that is determined by local assessors to be the total taxable value of land and additions on the property. | Land | Improvement |
|---|---|---|---|---|
| 2024 | $3,028 | $32,575 | -- | -- |
| 2023 | $3,028 | $32,575 | $0 | $0 |
| 2022 | $2,574 | $25,639 | $0 | $0 |
| 2021 | $2,657 | $25,639 | $0 | $0 |
| 2020 | $2,391 | $22,966 | $0 | $0 |
| 2019 | $2,378 | $22,966 | $0 | $0 |
| 2018 | $2,190 | $20,714 | $0 | $0 |
| 2017 | $1,905 | $20,714 | $0 | $0 |
| 2016 | $1,319 | $14,041 | $0 | $0 |
| 2015 | $1,273 | $14,041 | $0 | $0 |
| 2014 | -- | $10,053 | $0 | $0 |
| 2013 | -- | $9,510 | $0 | $0 |
Source: Public Records
Map
Nearby Homes