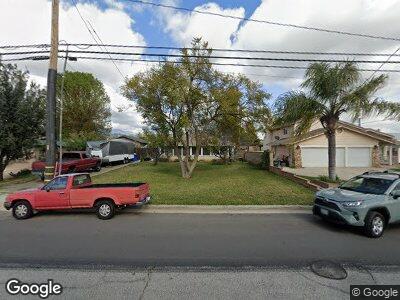
1097 3rd St Calimesa, CA 92320
Estimated Value: $467,179 - $512,000
3
Beds
2
Baths
1,344
Sq Ft
$366/Sq Ft
Est. Value
About This Home
This home is located at 1097 3rd St, Calimesa, CA 92320 and is currently estimated at $491,545, approximately $365 per square foot. 1097 3rd St is a home located in Riverside County with nearby schools including Calimesa Elementary, Mesa View Middle School, and Yucaipa High School.
Ownership History
Date
Name
Owned For
Owner Type
Purchase Details
Closed on
Dec 24, 2020
Sold by
Sornoso Kenneth
Bought by
Sornoso Kenneth
Current Estimated Value
Home Financials for this Owner
Home Financials are based on the most recent Mortgage that was taken out on this home.
Original Mortgage
$180,000
Interest Rate
2.7%
Mortgage Type
New Conventional
Purchase Details
Closed on
Apr 29, 2019
Sold by
Sornoso Patricia
Bought by
Sornoso Kenneth
Home Financials for this Owner
Home Financials are based on the most recent Mortgage that was taken out on this home.
Original Mortgage
$165,000
Interest Rate
4.3%
Mortgage Type
New Conventional
Purchase Details
Closed on
Oct 9, 2001
Sold by
Sornoso Victor and Sornoso Carmen
Bought by
Sornoso Kenneth and Sornoso Patricia
Home Financials for this Owner
Home Financials are based on the most recent Mortgage that was taken out on this home.
Original Mortgage
$87,000
Interest Rate
6.73%
Create a Home Valuation Report for This Property
The Home Valuation Report is an in-depth analysis detailing your home's value as well as a comparison with similar homes in the area
Home Values in the Area
Average Home Value in this Area
Purchase History
| Date | Buyer | Sale Price | Title Company |
|---|---|---|---|
| Sornoso Kenneth | -- | First American Title Company | |
| Sornoso Kenneth | -- | Ticor Title | |
| Sornoso Kenneth | -- | Gateway Title |
Source: Public Records
Mortgage History
| Date | Status | Borrower | Loan Amount |
|---|---|---|---|
| Closed | Sornoso Kenneth | $180,000 | |
| Closed | Sornoso Kenneth | $165,000 | |
| Closed | Sornoso Kenneth | $50,000 | |
| Closed | Sornoso Kenneth | $100,000 | |
| Closed | Sornoso Kenneth | $87,000 |
Source: Public Records
Tax History Compared to Growth
Tax History
| Year | Tax Paid | Tax Assessment Tax Assessment Total Assessment is a certain percentage of the fair market value that is determined by local assessors to be the total taxable value of land and additions on the property. | Land | Improvement |
|---|---|---|---|---|
| 2023 | $1,976 | $164,652 | $69,322 | $95,330 |
| 2022 | $1,909 | $161,424 | $67,963 | $93,461 |
| 2021 | $1,883 | $158,260 | $66,631 | $91,629 |
| 2020 | $1,881 | $156,638 | $65,948 | $90,690 |
| 2019 | $1,799 | $153,567 | $64,655 | $88,912 |
| 2018 | $1,781 | $150,557 | $63,389 | $87,168 |
| 2017 | $1,741 | $147,606 | $62,147 | $85,459 |
| 2016 | $1,705 | $144,713 | $60,929 | $83,784 |
| 2015 | $1,686 | $142,541 | $60,015 | $82,526 |
| 2014 | $1,651 | $139,751 | $58,841 | $80,910 |
Source: Public Records
Map
Nearby Homes
- 281 Harruby Dr
- 344 Smokeridge Trail
- 1225 2nd Place
- 349 Sandalwood Dr
- 1001 3rd St Unit 31
- 380 Smokeridge Trail
- 1290 3rd St
- 1270 Nugget Ct
- 173 Victoria Ln
- 244 Country Club Dr
- 245 Country Club Dr
- 950 California St Unit 87
- 950 California St Unit 119
- 1248 Holly Ln
- 34878 County Line Rd
- 34662 Turner Ln
- 222 Garden Air Ct
- 1229 Pinehurst Dr
- 219 Tanglewood Dr
- 206 Garden Air Ct