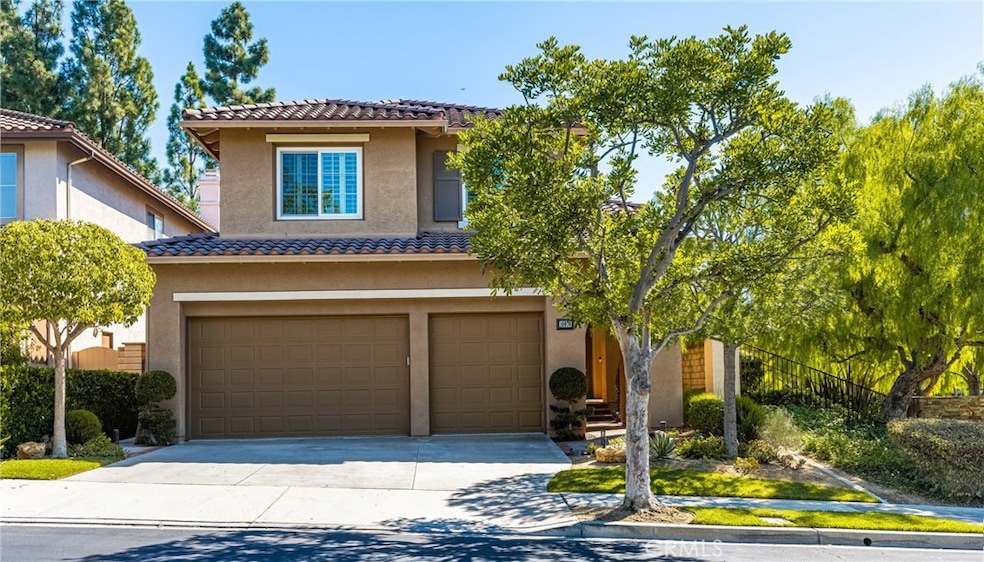
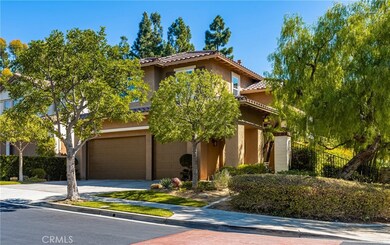
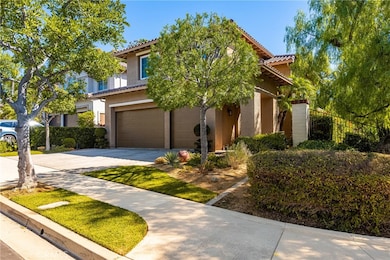
10970 Hiskey Ln Tustin, CA 92782
Tustin Ranch NeighborhoodEstimated payment $11,149/month
Highlights
- In Ground Pool
- Gated Community
- Open Floorplan
- Peters Canyon Elementary School Rated A
- Updated Kitchen
- Property is near a park
About This Home
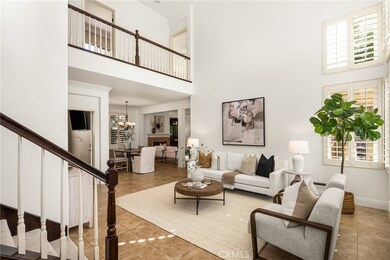
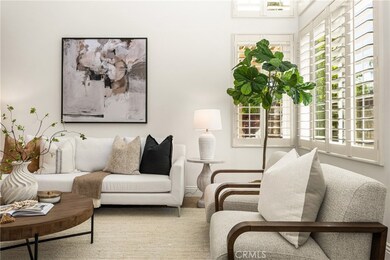
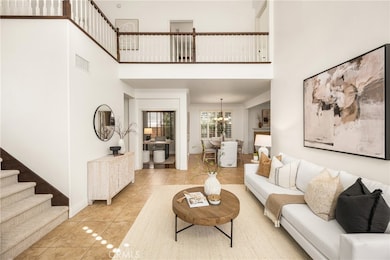
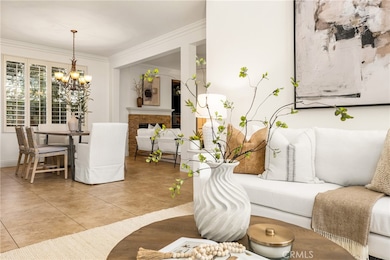
Great opportunity in the prestigious gated community of El-Dorado in Tustin Ranch. Spacious and versatile floorplan, highly upgraded with five bedrooms plus den downstairs. Open plan featuring a formal living room with vaulted ceilings, formal dining open to family room and kitchen creating a great room feel. Gourmet kitchen Remodeled with granite counters, stainless steel Vicking appliances, center island perfect for entertaining. Master bedroom with master bath and walk-in closet. Four full. bedrooms upstairs and a den/office downstairs with 3/4 baths. Private corner lot with great front yard and three car garages. Private backyard with in ground spa, patio cover perfect for outdoor activities. Located across from HOA pool and park. Minutes from schools, parks, Tustin Ranch golf course and Tustin Market place.
Listing Agent
Surterre Properties Inc Brokerage Phone: 949-230-4949 License #01172580 Listed on: 10/19/2025

Home Details
Home Type
- Single Family
Est. Annual Taxes
- $10,376
Year Built
- Built in 1998
Lot Details
- 4,500 Sq Ft Lot
- Block Wall Fence
- Corner Lot
- Sprinkler System
- Front Yard
HOA Fees
- $250 Monthly HOA Fees
Parking
- 3 Car Attached Garage
- Public Parking
- Parking Storage or Cabinetry
- Parking Available
- Side by Side Parking
- Two Garage Doors
- Garage Door Opener
- Driveway
Home Design
- Traditional Architecture
- Entry on the 1st floor
- Turnkey
- Planned Development
- Fire Rated Drywall
- Interior Block Wall
- Concrete Roof
- Pre-Cast Concrete Construction
- Concrete Perimeter Foundation
- Stucco
Interior Spaces
- 2,400 Sq Ft Home
- 2-Story Property
- Open Floorplan
- Built-In Features
- Crown Molding
- Cathedral Ceiling
- Gas Fireplace
- Double Pane Windows
- Shutters
- Entryway
- Family Room with Fireplace
- Great Room
- Family Room Off Kitchen
- Dining Room
- Den
- Bonus Room
- Laundry Room
Kitchen
- Updated Kitchen
- Open to Family Room
- Breakfast Bar
- Double Convection Oven
- Built-In Range
- Range Hood
- Microwave
- Dishwasher
- Kitchen Island
- Granite Countertops
- Disposal
Flooring
- Carpet
- Tile
Bedrooms and Bathrooms
- 5 Bedrooms | 1 Main Level Bedroom
- Walk-In Closet
- Remodeled Bathroom
- Bathroom on Main Level
- Granite Bathroom Countertops
- Dual Vanity Sinks in Primary Bathroom
- Bathtub with Shower
- Walk-in Shower
- Closet In Bathroom
Pool
- In Ground Pool
- Fence Around Pool
- Heated Spa
- In Ground Spa
Outdoor Features
- Wrap Around Porch
- Patio
- Exterior Lighting
- Rain Gutters
Location
- Property is near a park
Schools
- Pioneer Elementary And Middle School
- Beckman High School
Utilities
- Forced Air Heating and Cooling System
- Natural Gas Connected
- Private Water Source
- Gas Water Heater
- Cable TV Available
Listing and Financial Details
- Tax Lot 103
- Tax Tract Number 14410
- Assessor Parcel Number 52513160
- $300 per year additional tax assessments
- Seller Considering Concessions
Community Details
Overview
- El Dorado Association, Phone Number (800) 729-5673
- Tustin El Dorado HOA
- El Dorado Subdivision
Amenities
- Outdoor Cooking Area
- Picnic Area
Recreation
- Community Playground
- Community Pool
- Community Spa
- Park
Security
- Gated Community
Map
Home Values in the Area
Average Home Value in this Area
Tax History
| Year | Tax Paid | Tax Assessment Tax Assessment Total Assessment is a certain percentage of the fair market value that is determined by local assessors to be the total taxable value of land and additions on the property. | Land | Improvement |
|---|---|---|---|---|
| 2025 | $10,376 | $1,012,123 | $640,466 | $371,657 |
| 2024 | $10,376 | $992,278 | $627,908 | $364,370 |
| 2023 | $10,210 | $972,822 | $615,596 | $357,226 |
| 2022 | $11,512 | $953,748 | $603,526 | $350,222 |
| 2021 | $11,255 | $935,048 | $591,693 | $343,355 |
| 2020 | $11,090 | $925,461 | $585,626 | $339,835 |
| 2019 | $10,877 | $907,315 | $574,143 | $333,172 |
| 2018 | $10,639 | $889,525 | $562,885 | $326,640 |
| 2017 | $10,319 | $872,084 | $551,848 | $320,236 |
| 2016 | $10,134 | $854,985 | $541,028 | $313,957 |
| 2015 | $10,030 | $842,143 | $532,901 | $309,242 |
| 2014 | $9,933 | $825,647 | $522,462 | $303,185 |
Property History
| Date | Event | Price | List to Sale | Price per Sq Ft |
|---|---|---|---|---|
| 10/19/2025 10/19/25 | For Sale | $1,900,000 | -- | $792 / Sq Ft |
Purchase History
| Date | Type | Sale Price | Title Company |
|---|---|---|---|
| Deed | -- | -- | |
| Grant Deed | $790,000 | Stewart Title | |
| Interfamily Deed Transfer | -- | -- | |
| Grant Deed | $388,000 | South Coast Title Company |
Mortgage History
| Date | Status | Loan Amount | Loan Type |
|---|---|---|---|
| Previous Owner | $632,000 | New Conventional | |
| Previous Owner | $310,000 | No Value Available |
Source: California Regional Multiple Listing Service (CRMLS)
MLS Number: OC25234352
APN: 525-131-60
Disclaimer: Certain information contained herein is derived from information provided by parties other than Homes.com. All information provided is deemed reliable, but is not guaranteed to be accurate and should be independently verified.
![]() The multiple listing data appearing on this website, or contained in reports produced therefrom, is owned and copyrighted by California Regional Multiple Listing Service, Inc. ("CRMLS") and is protected by all applicable copyright laws. Information provided is for viewer's personal, non-commercial use and may not be used for any purpose other than to identify prospective properties the viewer may be interested in purchasing. All listing data, including but not limited to square footage and lot size is believed to be accurate, but the listing Agent, listing Broker and CRMLS and its affiliates do not warrant or guarantee such accuracy. The viewer should independently verify the listed data prior to making any decisions based on such information by personal inspection and/or contacting a real estate professional.
The multiple listing data appearing on this website, or contained in reports produced therefrom, is owned and copyrighted by California Regional Multiple Listing Service, Inc. ("CRMLS") and is protected by all applicable copyright laws. Information provided is for viewer's personal, non-commercial use and may not be used for any purpose other than to identify prospective properties the viewer may be interested in purchasing. All listing data, including but not limited to square footage and lot size is believed to be accurate, but the listing Agent, listing Broker and CRMLS and its affiliates do not warrant or guarantee such accuracy. The viewer should independently verify the listed data prior to making any decisions based on such information by personal inspection and/or contacting a real estate professional.
Based on information from California Regional Multiple Listing Service, Inc. and /or other sources. All data, including all measurements and calculations of area, is obtained from various sources and has not been, and will not be, verified by broker or MLS. All information should be independently reviewed and verified for accuracy. Properties may or may not be listed by the office/agent presenting the information
- 10940 Tantlinger Dr
- 2646 Dunstan Dr
- 2753 Dietrich Dr
- 2508 Platt Place
- 10885 Silverado Terrace
- 66 Poncho
- 61 English Saddle
- 10715 Plumas Way
- 90 Rockinghorse
- 52 Pedigree
- 65 Glacier Valley
- 2240 Foothill Blvd
- 55 Suede
- 10821 Bronco Cir
- 11755 Collar Ave
- 46 Shadybend
- 212 Clear Falls
- 116 Clear Falls
- 224 Clear Falls
- 1761 Lemon Terrace