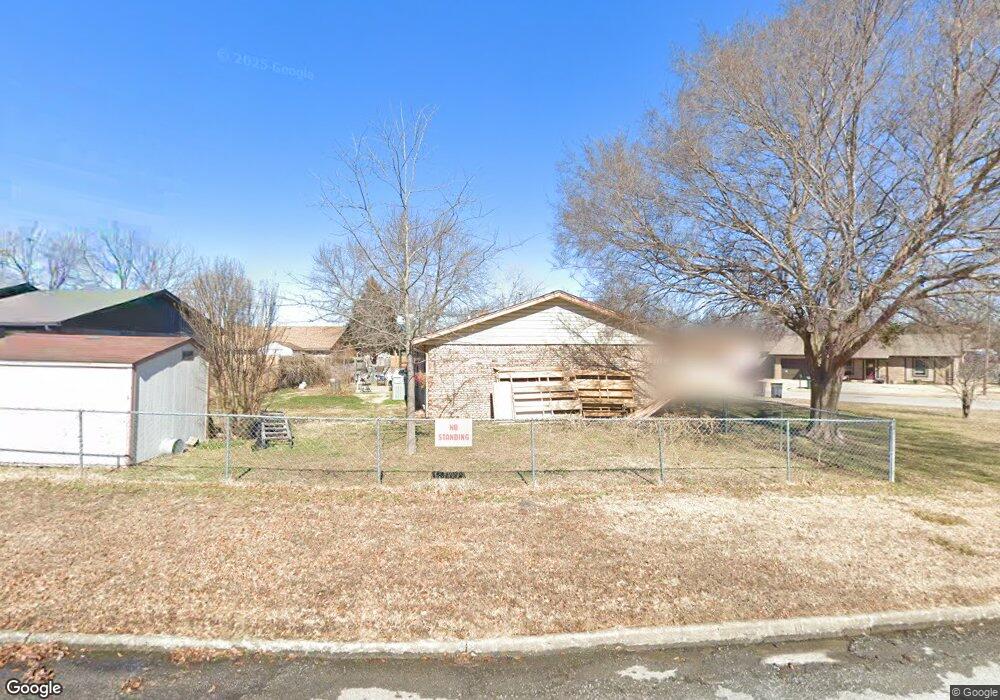
1099 E 144th St Glenpool, OK 74033
Estimated Value: $177,000 - $197,000
3
Beds
2
Baths
1,245
Sq Ft
$152/Sq Ft
Est. Value
About This Home
This home is located at 1099 E 144th St, Glenpool, OK 74033 and is currently estimated at $189,513, approximately $152 per square foot. 1099 E 144th St is a home located in Tulsa County with nearby schools including Glenpool Elementary School, Glenpool Middle School, and Glenpool High School.
Ownership History
Date
Name
Owned For
Owner Type
Purchase Details
Closed on
Mar 23, 2012
Sold by
Schumacher Philip W and Schumacher Candace M
Bought by
Schumacher Philip W and Schumacher Candace M
Current Estimated Value
Home Financials for this Owner
Home Financials are based on the most recent Mortgage that was taken out on this home.
Original Mortgage
$62,937
Outstanding Balance
$43,024
Interest Rate
3.92%
Mortgage Type
FHA
Estimated Equity
$146,489
Purchase Details
Closed on
May 12, 2006
Sold by
Hamm Barry Jason and Hamm Dawn Renee
Bought by
Schumacher Philip W and Schumacher Candace M
Purchase Details
Closed on
Nov 1, 1995
Purchase Details
Closed on
Oct 1, 1991
Create a Home Valuation Report for This Property
The Home Valuation Report is an in-depth analysis detailing your home's value as well as a comparison with similar homes in the area
Home Values in the Area
Average Home Value in this Area
Purchase History
| Date | Buyer | Sale Price | Title Company |
|---|---|---|---|
| Schumacher Philip W | -- | None Available | |
| Schumacher Philip W | $85,500 | The Executives Title & Escro | |
| -- | $50,000 | -- | |
| -- | $58,500 | -- |
Source: Public Records
Mortgage History
| Date | Status | Borrower | Loan Amount |
|---|---|---|---|
| Open | Schumacher Philip W | $62,937 |
Source: Public Records
Tax History
| Year | Tax Paid | Tax Assessment Tax Assessment Total Assessment is a certain percentage of the fair market value that is determined by local assessors to be the total taxable value of land and additions on the property. | Land | Improvement |
|---|---|---|---|---|
| 2025 | $1,396 | $11,640 | $1,108 | $10,532 |
| 2024 | $1,278 | $11,272 | $1,246 | $10,026 |
| 2023 | $1,278 | $11,914 | $1,385 | $10,529 |
| 2022 | $1,218 | $10,567 | $1,630 | $8,937 |
| 2021 | $1,197 | $10,230 | $1,578 | $8,652 |
| 2020 | $1,168 | $9,903 | $1,528 | $8,375 |
| 2019 | $1,138 | $9,586 | $1,479 | $8,107 |
| 2018 | $1,097 | $9,277 | $1,431 | $7,846 |
| 2017 | $1,038 | $9,978 | $1,539 | $8,439 |
| 2016 | $1,015 | $9,687 | $1,541 | $8,146 |
| 2015 | $977 | $9,405 | $1,496 | $7,909 |
| 2014 | $981 | $9,405 | $1,496 | $7,909 |
Source: Public Records
Map
Nearby Homes
- 1188 E 143rd St
- 1122 E 144th Place
- 243 E 141st St
- 1019 E 146th St S
- 14619 S Maple Place
- 1417 E 145th St S
- 1671 E 140th St
- 13827 S Quincy St
- 1172 E 148th St S
- 13761 S Nyssa Ct
- 14037 S Glen St
- 1104 E 137th St
- 1664 E 138th St S
- 1159 E 137th St
- 14708 S Hickory Cir
- 13816 S Iroquois Ave E
- 394 E 147th St S
- 1655 E 139th Ct
- 13804 S Glen Place
- 849 E 148th Place S
- 1085 E 144th St
- 14316 S Oklahoma Blvd
- 1079 E 144th St
- 14363 S Oklahoma Blvd
- 14343 S Oklahoma Blvd
- 1096 E 144th St
- 1102 E 144th St
- 14383 S Oklahoma Blvd
- 1084 E 144th St
- 14323 S Oklahoma Blvd
- 1124 E 144th St
- 1066 E 143rd St
- 14401 S Oklahoma Blvd
- 1072 E 144th St
- 14303 S Oklahoma Blvd
- 1058 E 143rd St
- 14328 S Kendalwood Blvd
- 14418 S Oklahoma Blvd
- 14411 S Oklahoma Blvd
- 1058 E 144th St
Your Personal Tour Guide
Ask me questions while you tour the home.