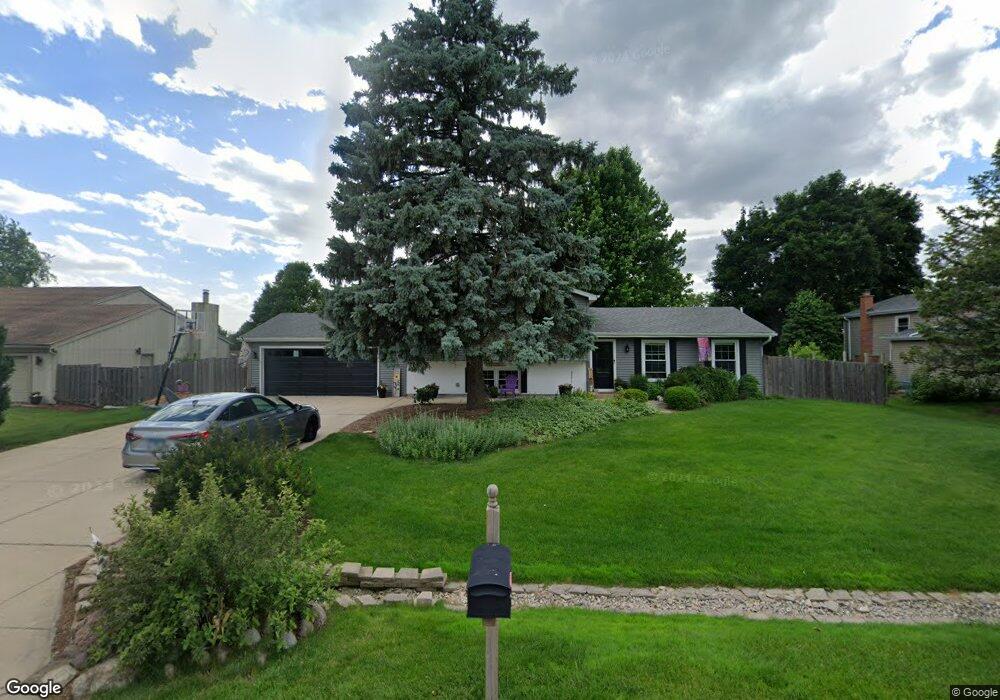
10S556 Windjammer St Naperville, IL 60564
Wood Lake NeighborhoodEstimated Value: $444,000 - $505,000
--
Bed
--
Bath
1,325
Sq Ft
$359/Sq Ft
Est. Value
About This Home
This home is located at 10S556 Windjammer St, Naperville, IL 60564 and is currently estimated at $475,514, approximately $358 per square foot. 10S556 Windjammer St is a home located in Will County with nearby schools including Williamsfield Elementary School, Welch Elementary School, and Ellsworth Elementary School.
Ownership History
Date
Name
Owned For
Owner Type
Purchase Details
Closed on
Nov 4, 2022
Sold by
Doreen A Rodriguez Declaration Of Trust
Bought by
Bella Gregory L and Bella Stacy B
Current Estimated Value
Home Financials for this Owner
Home Financials are based on the most recent Mortgage that was taken out on this home.
Original Mortgage
$358,900
Outstanding Balance
$347,409
Interest Rate
6.95%
Estimated Equity
$128,105
Purchase Details
Closed on
Mar 23, 2021
Sold by
Rodriguez Doreen A
Bought by
Rodriguez Doreen A and Doreen A Rodriguez Trust
Purchase Details
Closed on
Oct 18, 1998
Sold by
Bennett Edward F and Bennett Isabel J
Bought by
Rodriguez Doreen A
Home Financials for this Owner
Home Financials are based on the most recent Mortgage that was taken out on this home.
Original Mortgage
$56,000
Interest Rate
6.68%
Purchase Details
Closed on
Aug 17, 1994
Sold by
Bennett Edward F and Bennett Isabel J
Bought by
Edward & Isabel Bennett Trust
Create a Home Valuation Report for This Property
The Home Valuation Report is an in-depth analysis detailing your home's value as well as a comparison with similar homes in the area
Home Values in the Area
Average Home Value in this Area
Purchase History
| Date | Buyer | Sale Price | Title Company |
|---|---|---|---|
| Bella Gregory L | $370,000 | First American Title | |
| Rodriguez Doreen A | -- | Attorney | |
| Rodriguez Doreen A | $176,000 | -- | |
| Edward & Isabel Bennett Trust | -- | -- |
Source: Public Records
Mortgage History
| Date | Status | Borrower | Loan Amount |
|---|---|---|---|
| Open | Bella Gregory L | $358,900 | |
| Previous Owner | Rodriguez Doreen A | $56,000 |
Source: Public Records
Tax History Compared to Growth
Tax History
| Year | Tax Paid | Tax Assessment Tax Assessment Total Assessment is a certain percentage of the fair market value that is determined by local assessors to be the total taxable value of land and additions on the property. | Land | Improvement |
|---|---|---|---|---|
| 2024 | $7,860 | $139,469 | $25,941 | $113,528 |
| 2023 | $7,860 | $123,206 | $22,916 | $100,290 |
| 2022 | $4,624 | $95,643 | $21,679 | $73,964 |
| 2021 | $4,633 | $91,089 | $20,647 | $70,442 |
| 2020 | $4,624 | $89,646 | $20,320 | $69,326 |
| 2019 | $4,683 | $87,119 | $19,747 | $67,372 |
| 2018 | $4,782 | $83,058 | $19,376 | $63,682 |
| 2017 | $4,849 | $80,914 | $18,876 | $62,038 |
| 2016 | $4,826 | $79,173 | $18,470 | $60,703 |
| 2015 | -- | $76,128 | $17,760 | $58,368 |
| 2014 | -- | $73,630 | $17,760 | $55,870 |
| 2013 | -- | $73,630 | $17,760 | $55,870 |
Source: Public Records
Map
Nearby Homes
- 2207 Sisters Ave
- 2736 Bluewater Cir
- 2543 Dewes Ln
- 2866 Stonewater Dr Unit 102
- 2949 Brossman St
- 2636 Salix Cir
- 2611 Cedar Glade Dr Unit 204
- 28W555 Leverenz Rd
- 2511 Sheehan Dr Unit 203
- 1305 Morningstar Ct Unit 1A
- 1329 Neskola Ct
- 2301 Mecan Dr
- 2220 Waterleaf Ct Unit 204
- 2227 Waterleaf Ct Unit 203
- 1321 Galena Ct
- 3311 Fairmont Ave
- 3349 Rosecroft Ln Unit 2
- 2741 Gateshead Dr
- 3003 Kingbird Ct Unit IV
- 29W316 Andermann Dr
- 10S545 Windjammer Ln
- 29W184 Lakeside Dr
- 29W199 Lakeside Dr
- 10S540 Windjammer Ln
- 10S521 Windjammer St
- 10S570 Windjammer Ln
- 29W185 Lake Side Dr
- 29W168 Lakeside Dr
- 10S524 Wind Jammer Ln
- 10S524 Windjammer Ln
- 29W169 Lakeside Dr
- 10S505 Windjammer St
- 10S592 Windjammer Ln
- 29W152 Lakeside Dr
- 10S510 Windjammer Ln
- 10S491 Windjammer St
- 29W153 Lakeside Dr
- 2247 Joyce Ln
- 2243 Joyce Ln
- 2819 Bluewater Cir