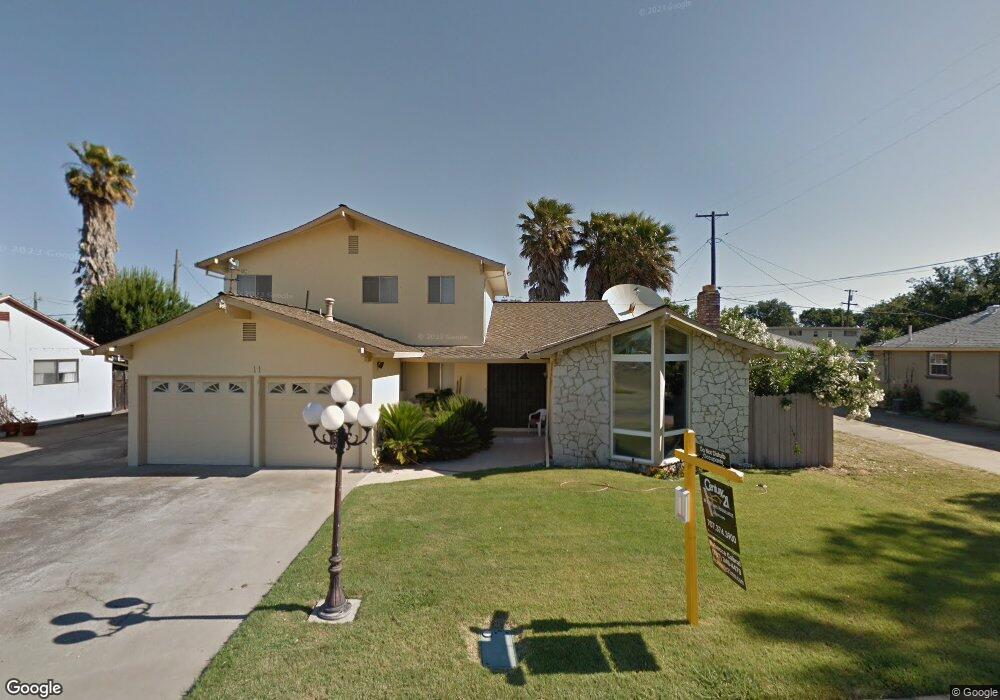
11 3rd Ave Isleton, CA 95641
Estimated Value: $484,000 - $570,000
3
Beds
3
Baths
2,794
Sq Ft
$189/Sq Ft
Est. Value
About This Home
This home is located at 11 3rd Ave, Isleton, CA 95641 and is currently estimated at $527,573, approximately $188 per square foot. 11 3rd Ave is a home located in Sacramento County with nearby schools including Isleton Elementary School, Riverview Middle School, and Rio Vista High School.
Ownership History
Date
Name
Owned For
Owner Type
Purchase Details
Closed on
May 22, 2018
Sold by
Cox John Edgar and Cox Kristina
Bought by
Pimentel Anthony M
Current Estimated Value
Home Financials for this Owner
Home Financials are based on the most recent Mortgage that was taken out on this home.
Original Mortgage
$377,535
Outstanding Balance
$326,554
Interest Rate
4.6%
Mortgage Type
FHA
Estimated Equity
$201,019
Purchase Details
Closed on
Jun 3, 2013
Sold by
Valine Mary Jane M
Bought by
Cox John Edgar and Cox Kristina
Home Financials for this Owner
Home Financials are based on the most recent Mortgage that was taken out on this home.
Original Mortgage
$184,000
Interest Rate
3.37%
Mortgage Type
New Conventional
Purchase Details
Closed on
Mar 18, 2010
Sold by
Adelle Berry
Bought by
Robert M/Betty J Valine Family Revocable
Purchase Details
Closed on
Oct 24, 2005
Sold by
Valine Robert M and Valine Betty J
Bought by
Valine Robert M and Valine Betty J
Create a Home Valuation Report for This Property
The Home Valuation Report is an in-depth analysis detailing your home's value as well as a comparison with similar homes in the area
Purchase History
| Date | Buyer | Sale Price | Title Company |
|---|---|---|---|
| Pimentel Anthony M | $384,500 | Fidelity National Title Comp | |
| Cox John Edgar | $230,000 | Placer Title Company | |
| Robert M/Betty J Valine Family Revocable | $1,100 | None Available | |
| Valine Robert M | -- | -- |
Source: Public Records
Mortgage History
| Date | Status | Borrower | Loan Amount |
|---|---|---|---|
| Open | Pimentel Anthony M | $377,535 | |
| Previous Owner | Cox John Edgar | $184,000 |
Source: Public Records
Tax History
| Year | Tax Paid | Tax Assessment Tax Assessment Total Assessment is a certain percentage of the fair market value that is determined by local assessors to be the total taxable value of land and additions on the property. | Land | Improvement |
|---|---|---|---|---|
| 2025 | $5,500 | $428,913 | $128,673 | $300,240 |
| 2024 | $5,500 | $420,503 | $126,150 | $294,353 |
| 2023 | $5,406 | $412,259 | $123,677 | $288,582 |
| 2022 | $5,330 | $404,176 | $121,252 | $282,924 |
| 2021 | $5,205 | $396,252 | $118,875 | $277,377 |
| 2020 | $5,071 | $392,190 | $117,657 | $274,533 |
| 2019 | $4,850 | $384,500 | $115,350 | $269,150 |
| 2018 | $2,736 | $248,917 | $32,466 | $216,451 |
| 2017 | $2,595 | $244,037 | $31,830 | $212,207 |
| 2016 | $2,552 | $239,253 | $31,206 | $208,047 |
| 2015 | $2,554 | $235,660 | $30,738 | $204,922 |
| 2014 | $2,530 | $231,044 | $30,136 | $200,908 |
Source: Public Records
Map
Nearby Homes
- 9 4th Ave
- 25 4th Ave
- 30 3rd Ave
- 330 Jackson Boulevard Extension
- 0 California 160
- 301 B St
- 00 Brannan Isle Rd
- 608 Union St
- 612 Union St
- 414 F St
- 39 Main St
- 0 6th St
- 0 6th St
- 58 Main St
- 706 Anne Marie Way
- 525 Brannan Isle
- 16637 Tyler Island Rd
- 665 W Tyler Island Bridge Rd
- 16073 Totem Dr
- 1777 Circle Dr
- 15 3rd Ave
- 9 3rd Ave
- 7 3rd Ave
- 12 3rd Ave
- 14 3rd Ave
- 14 3rd Ave
- 10 E 3rd St
- 19 3rd Ave
- 5 3rd Ave
- 18 3rd Ave
- 6 3rd Ave
- 14801 California 160 Unit 3
- 14801 California 160 Unit 31
- 14801 California 160
- 21 3rd Ave
- 14801 State Highway 160
- 14801 State Highway 160 Unit 36
- 14801 State Highway 160 Unit 5
- 14801 State Highway 160 Unit 4
- 14801 State Highway 160 Unit 14
Your Personal Tour Guide
Ask me questions while you tour the home.