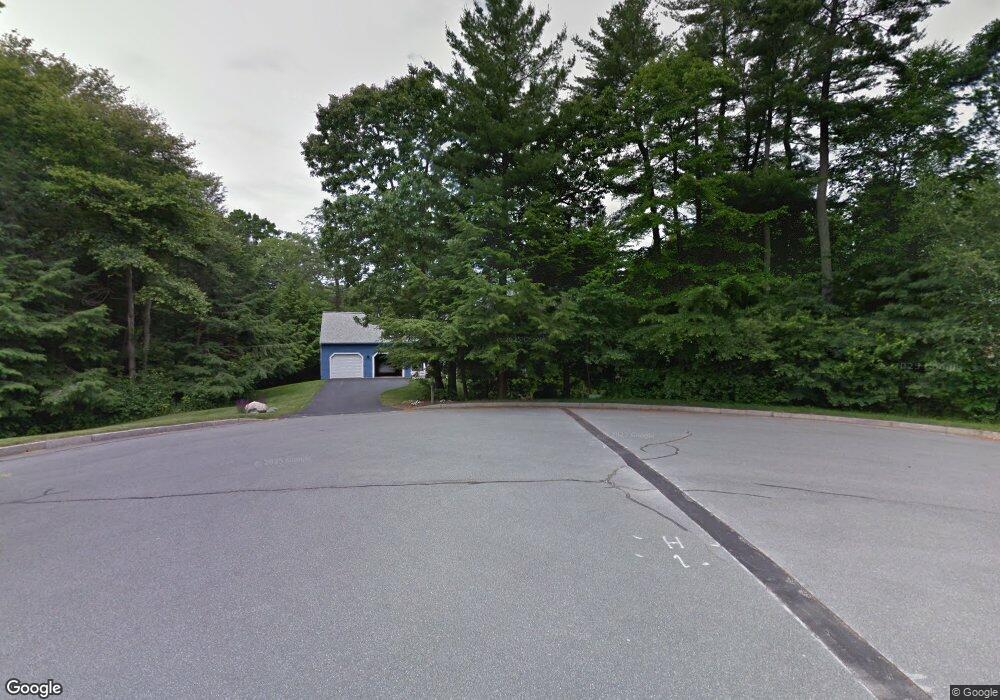
11 Adam Ln Hanover, MA 02339
Estimated Value: $910,000 - $1,128,000
4
Beds
4
Baths
2,252
Sq Ft
$444/Sq Ft
Est. Value
About This Home
This home is located at 11 Adam Ln, Hanover, MA 02339 and is currently estimated at $999,893, approximately $444 per square foot. 11 Adam Ln is a home located in Plymouth County with nearby schools including Hanover High School, Calvary Chapel Academy, and Holy Family Elementary School.
Ownership History
Date
Name
Owned For
Owner Type
Purchase Details
Closed on
Jul 1, 2025
Sold by
Richard P Hamilton 2016 T P and Richard Hamilton
Bought by
Richard & Mary Ft and Hamilton
Current Estimated Value
Purchase Details
Closed on
Mar 30, 2016
Sold by
Hamilton Richard P and Hamilton Mary C
Bought by
Richard P Hamilton T P and Richard Hamilton
Purchase Details
Closed on
Jul 29, 1992
Sold by
Merchants Bk Boston
Bought by
Hamilton Richard P and Hamilton Mary C
Home Financials for this Owner
Home Financials are based on the most recent Mortgage that was taken out on this home.
Original Mortgage
$105,000
Interest Rate
8.46%
Mortgage Type
Purchase Money Mortgage
Purchase Details
Closed on
Mar 12, 1992
Sold by
Continental Invest T
Bought by
Merchants Bk Boston
Create a Home Valuation Report for This Property
The Home Valuation Report is an in-depth analysis detailing your home's value as well as a comparison with similar homes in the area
Home Values in the Area
Average Home Value in this Area
Purchase History
| Date | Buyer | Sale Price | Title Company |
|---|---|---|---|
| Richard & Mary Ft | -- | -- | |
| Richard & Mary Ft | -- | -- | |
| Richard P Hamilton T P | -- | -- | |
| Richard P Hamilton T P | -- | -- | |
| Hamilton Richard P | $230,000 | -- | |
| Hamilton Richard P | $230,000 | -- | |
| Merchants Bk Boston | $201,100 | -- | |
| Merchants Bk Boston | $201,100 | -- |
Source: Public Records
Mortgage History
| Date | Status | Borrower | Loan Amount |
|---|---|---|---|
| Previous Owner | Merchants Bk Boston | $70,000 | |
| Previous Owner | Merchants Bk Boston | $75,600 | |
| Previous Owner | Merchants Bk Boston | $105,000 |
Source: Public Records
Tax History Compared to Growth
Tax History
| Year | Tax Paid | Tax Assessment Tax Assessment Total Assessment is a certain percentage of the fair market value that is determined by local assessors to be the total taxable value of land and additions on the property. | Land | Improvement |
|---|---|---|---|---|
| 2025 | $10,512 | $851,200 | $325,500 | $525,700 |
| 2024 | $10,272 | $800,000 | $325,500 | $474,500 |
| 2023 | $9,691 | $718,400 | $295,800 | $422,600 |
| 2022 | $9,941 | $628,300 | $246,500 | $381,800 |
| 2021 | $9,424 | $577,100 | $224,300 | $352,800 |
| 2020 | $8,951 | $548,800 | $224,300 | $324,500 |
| 2019 | $8,658 | $527,600 | $224,300 | $303,300 |
| 2018 | $8,098 | $497,400 | $224,300 | $273,100 |
| 2017 | $6,516 | $501,300 | $234,500 | $266,800 |
| 2016 | $7,990 | $473,900 | $213,200 | $260,700 |
| 2015 | $7,967 | $493,300 | $232,600 | $260,700 |
Source: Public Records
Map
Nearby Homes
- 141 Deerfield Ln
- 120 Deerfield Ln
- 206-208 Hinghm St
- 18 Midfield Dr
- 55 Turner Rd
- 3 Blueberry Ct
- 18 Colby St
- 216 Whiting St
- 354 Webster St
- 436 E Water St
- 7 Boxberry Ln Unit 7
- 507 Liberty St
- 65 Boxberry Ln
- 83 Summit St
- 775 Union St
- 737-739 Union St
- 1239 Main St
- 118 Bates Way
- 35-37 Salem St
- 80 Coolidge Rd