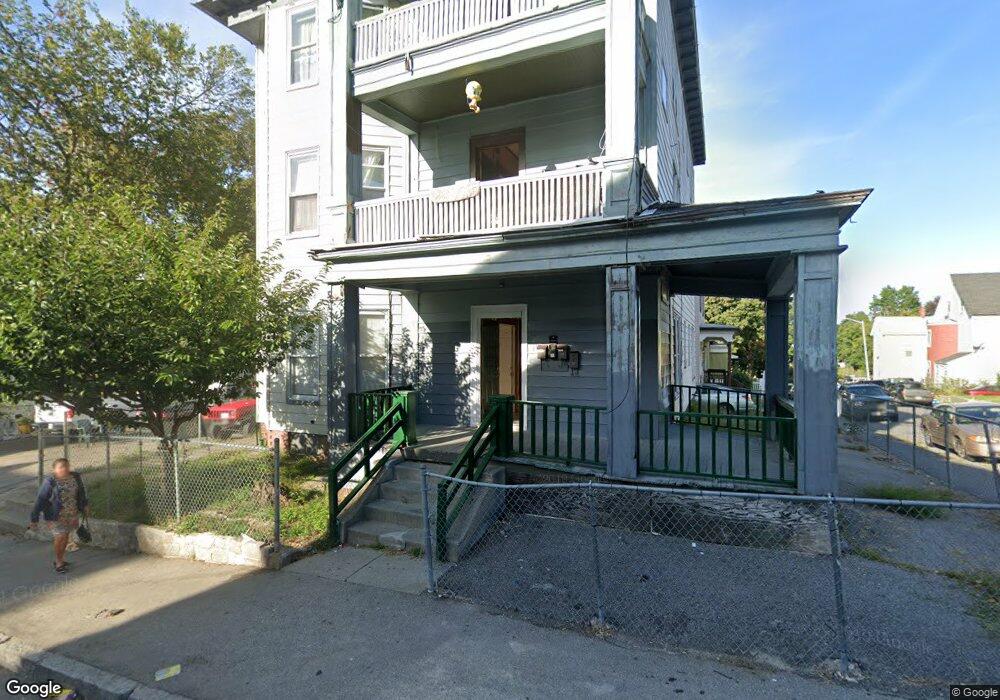
11 Allen St Worcester, MA 01610
Beacon Brightly NeighborhoodEstimated Value: $707,000 - $745,000
6
Beds
3
Baths
4,290
Sq Ft
$169/Sq Ft
Est. Value
About This Home
This home is located at 11 Allen St, Worcester, MA 01610 and is currently estimated at $725,667, approximately $169 per square foot. 11 Allen St is a home located in Worcester County with nearby schools including Jacob Hiatt Magnet School, Chandler Magnet, and Woodland Academy.
Ownership History
Date
Name
Owned For
Owner Type
Purchase Details
Closed on
Jul 1, 2004
Sold by
Gerace Scott T
Bought by
Phuong M
Current Estimated Value
Home Financials for this Owner
Home Financials are based on the most recent Mortgage that was taken out on this home.
Original Mortgage
$162,400
Outstanding Balance
$81,557
Interest Rate
6.3%
Mortgage Type
Purchase Money Mortgage
Estimated Equity
$644,110
Purchase Details
Closed on
Aug 30, 2001
Sold by
Redlitz John Henry
Bought by
Kinaeda Corp
Home Financials for this Owner
Home Financials are based on the most recent Mortgage that was taken out on this home.
Original Mortgage
$93,800
Interest Rate
7.06%
Mortgage Type
Purchase Money Mortgage
Create a Home Valuation Report for This Property
The Home Valuation Report is an in-depth analysis detailing your home's value as well as a comparison with similar homes in the area
Home Values in the Area
Average Home Value in this Area
Purchase History
| Date | Buyer | Sale Price | Title Company |
|---|---|---|---|
| Phuong M | $203,000 | -- | |
| Kinaeda Corp | $112,000 | -- |
Source: Public Records
Mortgage History
| Date | Status | Borrower | Loan Amount |
|---|---|---|---|
| Open | Phuong M | $162,400 | |
| Previous Owner | Kinaeda Corp | $95,300 | |
| Previous Owner | Kinaeda Corp | $93,800 |
Source: Public Records
Tax History
| Year | Tax Paid | Tax Assessment Tax Assessment Total Assessment is a certain percentage of the fair market value that is determined by local assessors to be the total taxable value of land and additions on the property. | Land | Improvement |
|---|---|---|---|---|
| 2025 | $7,783 | $590,100 | $70,900 | $519,200 |
| 2024 | $7,146 | $519,700 | $70,900 | $448,800 |
| 2023 | $6,789 | $473,400 | $56,900 | $416,500 |
| 2022 | $5,911 | $388,600 | $45,500 | $343,100 |
| 2021 | $5,299 | $325,500 | $36,400 | $289,100 |
| 2020 | $4,879 | $287,000 | $36,500 | $250,500 |
| 2019 | $4,394 | $244,100 | $36,000 | $208,100 |
| 2018 | $4,287 | $226,700 | $36,000 | $190,700 |
| 2017 | $4,011 | $208,700 | $36,000 | $172,700 |
| 2016 | $3,918 | $190,100 | $29,700 | $160,400 |
| 2015 | $3,815 | $190,100 | $29,700 | $160,400 |
| 2014 | $3,715 | $190,100 | $29,700 | $160,400 |
Source: Public Records
Map
Nearby Homes
- 6 Mount Pleasant St
- 7 Allen St
- 10 Allen St Unit 1F
- 10 Allen St Unit 2F
- 14 Allen St
- 8 Allen St Unit 3R
- 8 Allen St Unit 2F
- 8 Allen St Unit 3F
- 8 Allen St Unit 1R
- 8 Allen St
- 4 Mount Pleasant St
- 7 Mount Pleasant St
- 7 Mt Pleasant
- 5 Mount Pleasant St Unit 2
- 16 Allen St
- 3 Mount Pleasant St
- 3 Mount Pleasant St Unit 3
- 3 Mount Pleasant St Unit 3rd Floor
- 12 Benefit St
- 3 Allen St Unit 6