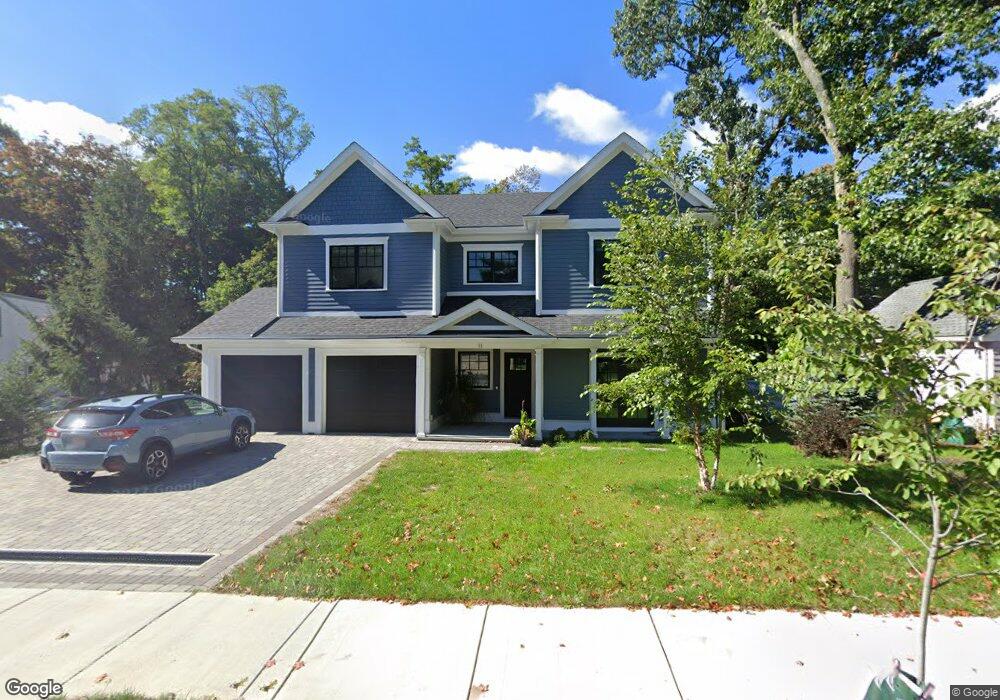
11 Baker Place Newton Lower Falls, MA 02462
Newton Lower Falls NeighborhoodEstimated Value: $2,172,000 - $2,917,000
5
Beds
7
Baths
3,326
Sq Ft
$801/Sq Ft
Est. Value
About This Home
This home is located at 11 Baker Place, Newton Lower Falls, MA 02462 and is currently estimated at $2,664,573, approximately $801 per square foot. 11 Baker Place is a home located in Middlesex County with nearby schools including Angier Elementary School, Charles E Brown Middle School, and Newton South High School.
Ownership History
Date
Name
Owned For
Owner Type
Purchase Details
Closed on
Oct 6, 2020
Sold by
11 Baker Place Llc
Bought by
Dioun Hamid
Current Estimated Value
Purchase Details
Closed on
May 30, 2018
Sold by
Joseph F Bartzak Home
Bought by
11 Baker Place Llc
Home Financials for this Owner
Home Financials are based on the most recent Mortgage that was taken out on this home.
Original Mortgage
$1,480,000
Interest Rate
4.4%
Mortgage Type
Unknown
Purchase Details
Closed on
Jan 13, 2015
Sold by
Bartzak Joseph F
Bought by
Joseph F Bartzak Home
Create a Home Valuation Report for This Property
The Home Valuation Report is an in-depth analysis detailing your home's value as well as a comparison with similar homes in the area
Home Values in the Area
Average Home Value in this Area
Purchase History
| Date | Buyer | Sale Price | Title Company |
|---|---|---|---|
| Dioun Hamid | $2,075,000 | None Available | |
| 11 Baker Place Llc | $730,000 | -- | |
| Joseph F Bartzak Home | -- | -- |
Source: Public Records
Mortgage History
| Date | Status | Borrower | Loan Amount |
|---|---|---|---|
| Previous Owner | 11 Baker Place Llc | $1,480,000 |
Source: Public Records
Tax History Compared to Growth
Tax History
| Year | Tax Paid | Tax Assessment Tax Assessment Total Assessment is a certain percentage of the fair market value that is determined by local assessors to be the total taxable value of land and additions on the property. | Land | Improvement |
|---|---|---|---|---|
| 2025 | $24,129 | $2,462,100 | $901,000 | $1,561,100 |
| 2024 | $23,330 | $2,390,400 | $874,800 | $1,515,600 |
| 2023 | $22,642 | $2,224,200 | $673,700 | $1,550,500 |
| 2022 | $21,665 | $2,059,400 | $623,800 | $1,435,600 |
| 2021 | $11,764 | $1,093,300 | $535,100 | $558,200 |
| 2020 | $6,967 | $667,300 | $535,100 | $132,200 |
| 2019 | $6,953 | $665,400 | $529,200 | $136,200 |
| 2018 | $5,837 | $539,500 | $476,200 | $63,300 |
| 2017 | $5,660 | $509,000 | $449,200 | $59,800 |
| 2016 | $5,413 | $475,700 | $419,800 | $55,900 |
| 2015 | $5,162 | $444,600 | $392,300 | $52,300 |
Source: Public Records
Map
Nearby Homes
- 25 Columbia St
- 45 Moulton St
- 17 Deforest Rd
- 7 Crescent St
- 2084 Washington St
- 45 E Quinobequin Rd
- 8 Old Town Rd
- 2 Longfellow Rd
- 34 Palmer Rd
- 12 Bird Hill Ave
- 135 Orchard Ave
- 41 Orchard Ave
- 27 Oakwood Rd
- 177 Varick Rd
- 20 Oakland Street Front
- 10 Lorraine Cir
- 54 Colburn Rd
- 17 Lasell St
- 52 Valley Rd
- 33 Metacomet Rd
- 17 Baker Place
- 5 Baker Place
- 18 Neal St
- 10 Baker Place
- 25 Baker Place
- 18 Baker Place
- 18 Baker Place Unit 1
- 4 Neal St
- 54 Saint Marys St
- 60 Saint Marys St
- 48 Saint Marys St
- 66 Saint Marys St
- 5 Neal St
- 30 Baker Place
- 30 Baker Place Unit 30
- 11 Neal St
- 29 Baker Place
- 19 Neal St
- 59 Cornell St Unit 61
- 42 Saint Marys St