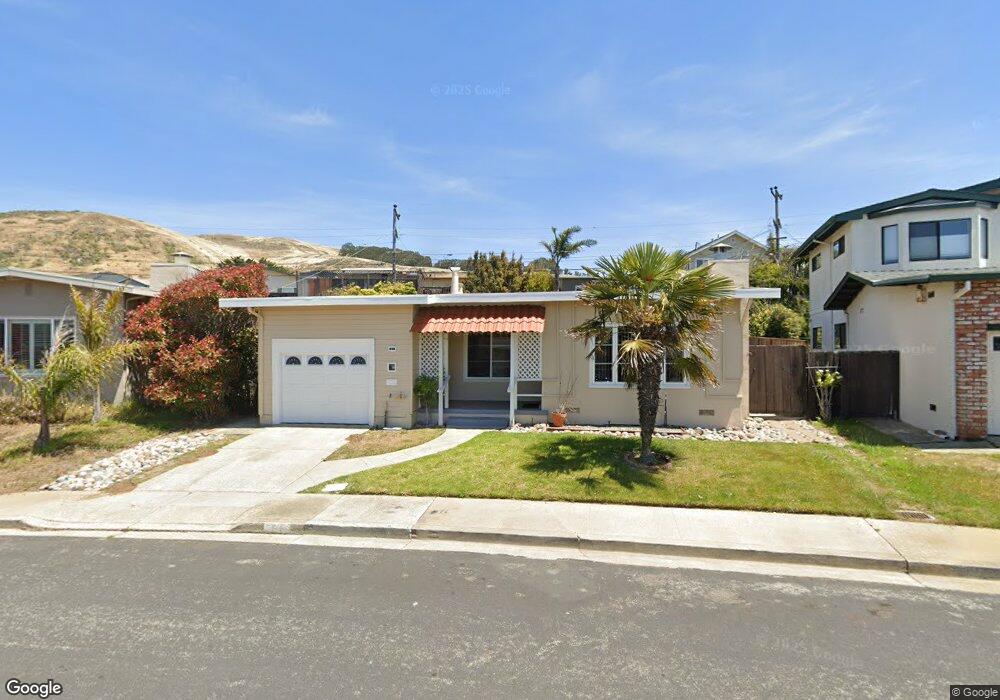
11 Beverly Ct South San Francisco, CA 94080
Sunshine Gardens NeighborhoodEstimated Value: $1,123,493 - $1,256,000
3
Beds
1
Bath
1,000
Sq Ft
$1,172/Sq Ft
Est. Value
About This Home
This home is located at 11 Beverly Ct, South San Francisco, CA 94080 and is currently estimated at $1,171,623, approximately $1,171 per square foot. 11 Beverly Ct is a home located in San Mateo County with nearby schools including Sunshine Gardens Elementary School, Parkway Heights Middle School, and El Camino High School.
Ownership History
Date
Name
Owned For
Owner Type
Purchase Details
Closed on
Sep 9, 2019
Sold by
Tang Victor C and To Tang May M
Bought by
Tang Victor C and To Tang May M
Current Estimated Value
Purchase Details
Closed on
Jun 2, 2009
Sold by
Munoz Carmen G
Bought by
Tang Victor and To Tang May M
Purchase Details
Closed on
Jun 18, 2007
Sold by
Gutierrez Daniel
Bought by
Munoz Carmen G
Home Financials for this Owner
Home Financials are based on the most recent Mortgage that was taken out on this home.
Original Mortgage
$560,000
Interest Rate
6.21%
Mortgage Type
New Conventional
Purchase Details
Closed on
Jan 13, 2004
Sold by
Paras Nancy Ann
Bought by
Gutierrez Daniel and Munoz Carmen G
Home Financials for this Owner
Home Financials are based on the most recent Mortgage that was taken out on this home.
Original Mortgage
$440,000
Interest Rate
5.86%
Mortgage Type
Purchase Money Mortgage
Create a Home Valuation Report for This Property
The Home Valuation Report is an in-depth analysis detailing your home's value as well as a comparison with similar homes in the area
Home Values in the Area
Average Home Value in this Area
Purchase History
| Date | Buyer | Sale Price | Title Company |
|---|---|---|---|
| Tang Victor C | -- | None Available | |
| Tang Victor | $460,500 | Old Republic Title Company | |
| Munoz Carmen G | -- | North American Title Co | |
| Gutierrez Daniel | $550,000 | Fidelity National Title Co |
Source: Public Records
Mortgage History
| Date | Status | Borrower | Loan Amount |
|---|---|---|---|
| Previous Owner | Munoz Carmen G | $560,000 | |
| Previous Owner | Gutierrez Daniel | $440,000 | |
| Closed | Gutierrez Daniel | $55,000 |
Source: Public Records
Tax History Compared to Growth
Tax History
| Year | Tax Paid | Tax Assessment Tax Assessment Total Assessment is a certain percentage of the fair market value that is determined by local assessors to be the total taxable value of land and additions on the property. | Land | Improvement |
|---|---|---|---|---|
| 2025 | $7,190 | $592,996 | $296,498 | $296,498 |
| 2023 | $7,190 | $569,972 | $284,986 | $284,986 |
| 2022 | $6,683 | $558,798 | $279,399 | $279,399 |
| 2021 | $6,596 | $547,842 | $273,921 | $273,921 |
| 2020 | $6,514 | $542,226 | $271,113 | $271,113 |
| 2019 | $6,446 | $531,596 | $265,798 | $265,798 |
| 2018 | $6,294 | $521,174 | $260,587 | $260,587 |
| 2017 | $6,127 | $510,956 | $255,478 | $255,478 |
| 2016 | $5,988 | $500,938 | $250,469 | $250,469 |
| 2015 | $5,891 | $493,414 | $246,707 | $246,707 |
| 2014 | $5,764 | $483,750 | $241,875 | $241,875 |
Source: Public Records
Map
Nearby Homes
- 829 Stonegate Dr
- 252 Sequoia Ave
- 728 Cottonwood Ave
- 69 Windcrest Ln
- 121 Northcrest Dr
- 729 Grand Ave
- 719 Circle Ct
- 889 Mclellan Dr Unit 302
- 889 Mclellan Dr Unit 205
- 645 Baden Ave Unit 4
- 311 Magnolia Ave
- 577 Miller Ave
- 573 Miller Ave
- 632 1st Ln
- 16 Cymbidium Cir
- 553 Diamond Ave
- 0 Indio Dr
- 8 Parkgrove Dr
- 616 Mayfair Ave
- 1700 El Camino Real Unit 2-03
- 15 Beverly Ct
- 7 Beverly Ct
- 1075 Crestwood Dr
- 1079 Crestwood Dr
- 1083 Crestwood Dr
- 19 Beverly Ct
- 1071 Crestwood Dr
- 392 Dolores Way
- 2 Beverly Ct
- 1059 Crestwood Dr
- 1055 Crestwood Dr
- 1087 Crestwood Dr
- 1051 Crestwood Dr
- 378 Dolores Way
- 25 Beverly Ct
- 1047 Crestwood Dr
- 398 Dolores Way
- 374 Dolores Way
- 387 Dolores Way
- 391 Dolores Way