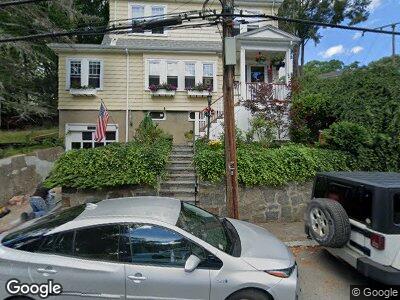
11 Brook Farm Rd West Roxbury, MA 02132
West Roxbury NeighborhoodEstimated Value: $677,000 - $873,000
3
Beds
2
Baths
1,582
Sq Ft
$513/Sq Ft
Est. Value
About This Home
This home is located at 11 Brook Farm Rd, West Roxbury, MA 02132 and is currently estimated at $811,084, approximately $512 per square foot. 11 Brook Farm Rd is a home located in Suffolk County with nearby schools including Holy Name Parish School, St Theresa School, and Catholic Memorial School.
Ownership History
Date
Name
Owned For
Owner Type
Purchase Details
Closed on
Jun 13, 2008
Sold by
Carrigg Anne T and Carrigg George A
Bought by
Carrigg Catherine M
Current Estimated Value
Purchase Details
Closed on
Sep 1, 2000
Sold by
Robinson Joseph and Robinson Elizabeth
Bought by
Solomon Joel B and Balogh Susan M
Home Financials for this Owner
Home Financials are based on the most recent Mortgage that was taken out on this home.
Original Mortgage
$232,000
Interest Rate
8.16%
Mortgage Type
Purchase Money Mortgage
Create a Home Valuation Report for This Property
The Home Valuation Report is an in-depth analysis detailing your home's value as well as a comparison with similar homes in the area
Home Values in the Area
Average Home Value in this Area
Purchase History
| Date | Buyer | Sale Price | Title Company |
|---|---|---|---|
| Carrigg Catherine M | -- | -- | |
| Carrigg Catherine M | -- | -- | |
| Solomon Joel B | $290,000 | -- |
Source: Public Records
Mortgage History
| Date | Status | Borrower | Loan Amount |
|---|---|---|---|
| Open | Solomon Joel B | $725,000 | |
| Closed | Solomon Joel B | $150,000 | |
| Closed | Solomon Joel B | $359,505 | |
| Previous Owner | Soloman Joel B | $80,400 | |
| Previous Owner | Solomon Joel | $75,000 | |
| Previous Owner | Solomon Joel B | $75,000 | |
| Previous Owner | Solomon Joel B | $355,000 | |
| Previous Owner | Solomon Joel B | $59,800 | |
| Previous Owner | Solomon Joel B | $232,000 | |
| Closed | Solomon Joel B | $43,500 |
Source: Public Records
Tax History Compared to Growth
Tax History
| Year | Tax Paid | Tax Assessment Tax Assessment Total Assessment is a certain percentage of the fair market value that is determined by local assessors to be the total taxable value of land and additions on the property. | Land | Improvement |
|---|---|---|---|---|
| 2025 | $8,599 | $742,600 | $209,000 | $533,600 |
| 2024 | $8,044 | $738,000 | $218,400 | $519,600 |
| 2023 | $7,692 | $716,200 | $211,900 | $504,300 |
| 2022 | $7,085 | $651,200 | $192,700 | $458,500 |
| 2021 | $6,463 | $605,700 | $183,500 | $422,200 |
| 2020 | $5,853 | $554,300 | $170,600 | $383,700 |
| 2019 | $5,616 | $532,800 | $137,800 | $395,000 |
| 2018 | $5,171 | $493,400 | $137,800 | $355,600 |
| 2017 | $5,121 | $483,600 | $137,800 | $345,800 |
| 2016 | $4,680 | $425,410 | $130,910 | $294,500 |
| 2015 | $4,954 | $409,100 | $144,500 | $264,600 |
| 2014 | $4,856 | $386,000 | $144,500 | $241,500 |
Source: Public Records
Map
Nearby Homes
- 1 Marlin Rd
- 59 Chellman St
- 76 Brook Farm Rd
- 92 Westover St
- 95 Anderer Ln Unit 7
- 97 Anderer Ln Unit 105
- 1 Furbush Rd
- 100 Anderer Ln Unit 3
- 589 Weld St
- 14 Hodgdon Terrace
- 15 Hodgdon Terrace
- 633 Lagrange St
- 52 Garth Rd
- 28 Westgate Rd Unit 3
- 125 Redlands Rd Unit 2
- 125 Redlands Rd Unit 1
- 20 Westgate Rd Unit 6
- 121-123 Willow St
- 293 Temple St Unit 101
- 96 Redlands Rd Unit 3
- 11 Brook Farm Rd
- 334 Corey St
- 330 Corey St
- 19 Brook Farm Rd
- 715 Vfw Pkwy
- 6 Brook Farm Rd
- 6 Brook Farm Rd Unit 1
- 22 Brook Farm Rd
- 2 Brook Farm Rd Unit 2
- 21 Brook Farm Rd
- 24 Brook Farm Rd
- 725 V F Pkwy W Unit 2ND Floor
- 351 Corey St
- 725 Vfw Pkwy Unit 725
- 725 Vfw Pkwy Unit 2
- 709 Vfw Pkwy Unit 2
- 709 Vfw Pkwy
- 347 Corey St
- 25 Brook Farm Rd
- 355 Corey St