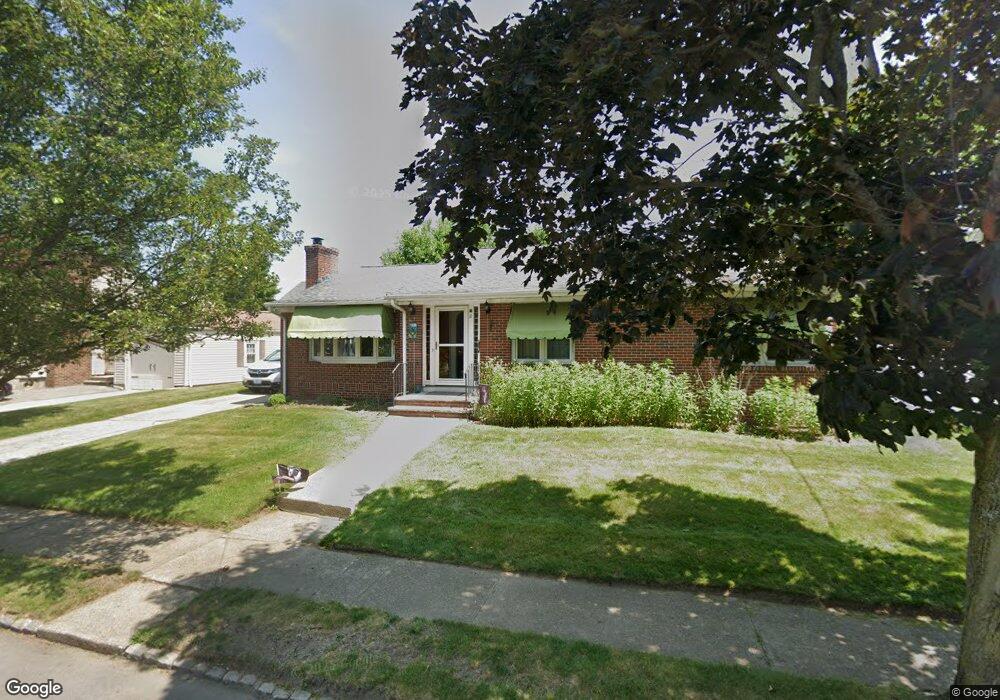
11 Bryant Rd Cranston, RI 02910
Eden Park NeighborhoodEstimated Value: $408,924 - $461,000
3
Beds
1
Bath
1,380
Sq Ft
$320/Sq Ft
Est. Value
About This Home
This home is located at 11 Bryant Rd, Cranston, RI 02910 and is currently estimated at $441,231, approximately $319 per square foot. 11 Bryant Rd is a home located in Providence County with nearby schools including Park View Middle School, Cranston High School East, and Cadence Academy Preschool - Cranston.
Ownership History
Date
Name
Owned For
Owner Type
Purchase Details
Closed on
May 5, 2022
Sold by
Myette James B and Myette Brenda H
Bought by
James B & B H Myette Lt
Current Estimated Value
Purchase Details
Closed on
May 27, 1997
Sold by
Saabye Robert H
Bought by
Myette James B and Myette Brenda
Create a Home Valuation Report for This Property
The Home Valuation Report is an in-depth analysis detailing your home's value as well as a comparison with similar homes in the area
Home Values in the Area
Average Home Value in this Area
Purchase History
| Date | Buyer | Sale Price | Title Company |
|---|---|---|---|
| James B & B H Myette Lt | -- | None Available | |
| Myette James B | $105,000 | -- |
Source: Public Records
Mortgage History
| Date | Status | Borrower | Loan Amount |
|---|---|---|---|
| Previous Owner | Myette James B | $118,000 | |
| Previous Owner | Myette James B | $68,900 | |
| Previous Owner | Myette James B | $124,000 |
Source: Public Records
Tax History
| Year | Tax Paid | Tax Assessment Tax Assessment Total Assessment is a certain percentage of the fair market value that is determined by local assessors to be the total taxable value of land and additions on the property. | Land | Improvement |
|---|---|---|---|---|
| 2025 | $4,819 | $347,200 | $108,800 | $238,400 |
| 2024 | $4,725 | $347,200 | $108,800 | $238,400 |
| 2023 | $4,640 | $245,500 | $71,700 | $173,800 |
| 2022 | $4,544 | $245,500 | $71,700 | $173,800 |
| 2021 | $4,419 | $245,500 | $71,700 | $173,800 |
| 2020 | $4,158 | $200,200 | $68,200 | $132,000 |
| 2019 | $4,158 | $200,200 | $68,200 | $132,000 |
| 2018 | $4,062 | $200,200 | $68,200 | $132,000 |
| 2017 | $4,138 | $180,400 | $61,400 | $119,000 |
| 2016 | $4,050 | $180,400 | $61,400 | $119,000 |
| 2015 | $4,050 | $180,400 | $61,400 | $119,000 |
| 2014 | $3,922 | $171,700 | $61,400 | $110,300 |
Source: Public Records
Map
Nearby Homes
Your Personal Tour Guide
Ask me questions while you tour the home.