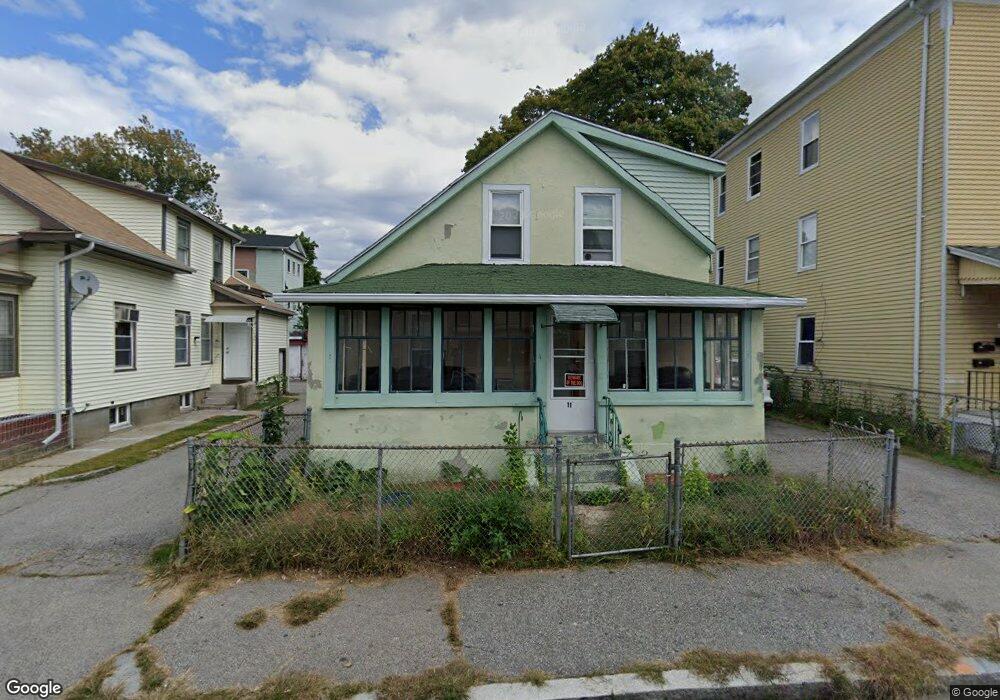
11 Camp St Worcester, MA 01603
South Worcester NeighborhoodEstimated Value: $273,000 - $315,000
4
Beds
1
Bath
1,323
Sq Ft
$217/Sq Ft
Est. Value
About This Home
This home is located at 11 Camp St, Worcester, MA 01603 and is currently estimated at $286,919, approximately $216 per square foot. 11 Camp St is a home located in Worcester County with nearby schools including Jacob Hiatt Magnet School, Chandler Magnet, and University Park Campus School.
Ownership History
Date
Name
Owned For
Owner Type
Purchase Details
Closed on
Oct 23, 2012
Sold by
Nguyen Tam H and Do Dung K
Bought by
D&B Real Est Hldgs Llc
Current Estimated Value
Home Financials for this Owner
Home Financials are based on the most recent Mortgage that was taken out on this home.
Original Mortgage
$300,000
Outstanding Balance
$208,327
Interest Rate
3.57%
Mortgage Type
New Conventional
Estimated Equity
$78,592
Purchase Details
Closed on
Sep 24, 2010
Sold by
Derosiers Leon L and Kane Pauline
Bought by
Nguyen Tam H and Do Dung Kim
Create a Home Valuation Report for This Property
The Home Valuation Report is an in-depth analysis detailing your home's value as well as a comparison with similar homes in the area
Home Values in the Area
Average Home Value in this Area
Purchase History
| Date | Buyer | Sale Price | Title Company |
|---|---|---|---|
| D&B Real Est Hldgs Llc | -- | -- | |
| Nguyen Tam H | $40,000 | -- |
Source: Public Records
Mortgage History
| Date | Status | Borrower | Loan Amount |
|---|---|---|---|
| Open | D&B Real Est Hldgs Llc | $300,000 |
Source: Public Records
Tax History
| Year | Tax Paid | Tax Assessment Tax Assessment Total Assessment is a certain percentage of the fair market value that is determined by local assessors to be the total taxable value of land and additions on the property. | Land | Improvement |
|---|---|---|---|---|
| 2025 | $2,047 | $155,200 | $46,100 | $109,100 |
| 2024 | $1,959 | $142,500 | $46,100 | $96,400 |
| 2023 | $1,830 | $127,600 | $36,400 | $91,200 |
| 2022 | $1,690 | $111,100 | $29,200 | $81,900 |
| 2021 | $1,786 | $109,700 | $23,300 | $86,400 |
| 2020 | $1,690 | $99,400 | $23,300 | $76,100 |
| 2019 | $1,728 | $96,000 | $22,300 | $73,700 |
| 2018 | $1,717 | $90,800 | $22,300 | $68,500 |
| 2017 | $1,636 | $85,100 | $22,300 | $62,800 |
| 2016 | $1,676 | $81,300 | $15,900 | $65,400 |
| 2015 | $1,632 | $81,300 | $15,900 | $65,400 |
| 2014 | $1,589 | $81,300 | $15,900 | $65,400 |
Source: Public Records
Map
Nearby Homes
- 407 Cambridge St Unit 1
- 83 Canterbury St
- 103 Illinois St
- 52 Richards St
- 56 Richards St
- 54 Richards St
- 18 Crystal St
- 14 Hancock St
- 20 Washburn St
- 7 Wyman St
- 5 Freeland Terrace
- 200 Beacon St
- 607 Cambridge St Unit 4
- 5 Ripley Place
- 12 Stoneland Rd
- 5 Stoneland Rd
- 1038 Main St
- 10 Lucian St
- 19 Woodbine St
- 33 Florence St
Your Personal Tour Guide
Ask me questions while you tour the home.