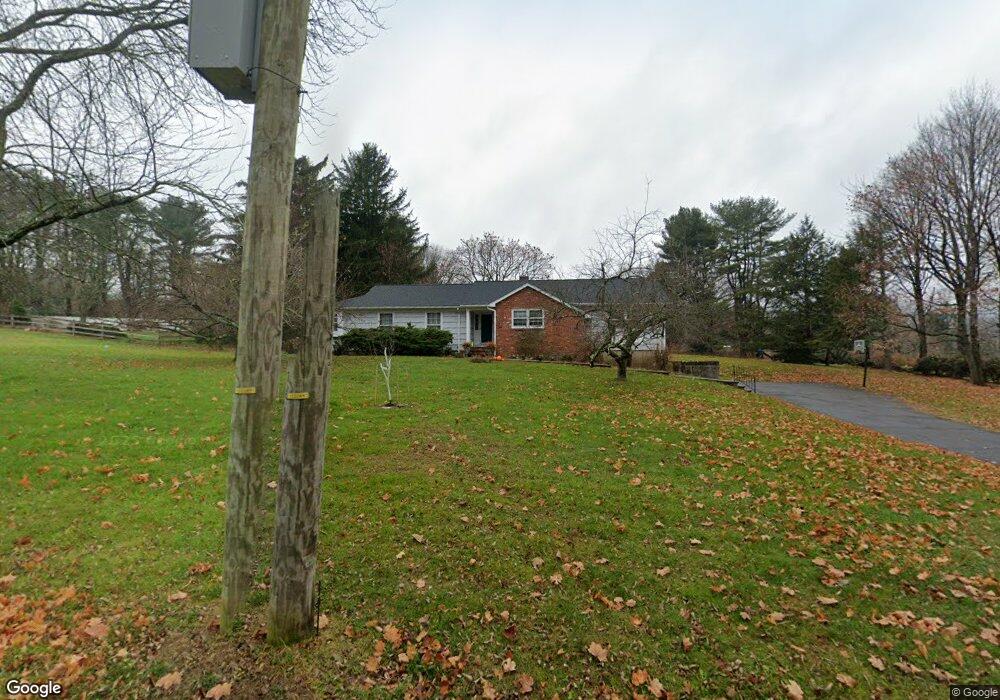
11 Cherry Ln Brookside, NJ 07926
Estimated Value: $831,000 - $1,160,000
Studio
--
Bath
2,161
Sq Ft
$427/Sq Ft
Est. Value
About This Home
This home is located at 11 Cherry Ln, Brookside, NJ 07926 and is currently estimated at $923,184, approximately $427 per square foot. 11 Cherry Ln is a home with nearby schools including Mendham Township Elementary School, Mendham Township Middle School, and West Morris Mendham High School.
Ownership History
Date
Name
Owned For
Owner Type
Purchase Details
Closed on
Jul 5, 1998
Sold by
Macdonald Timothy A and Macdonald T
Bought by
Chernin Wayne and Chernin Abby
Current Estimated Value
Home Financials for this Owner
Home Financials are based on the most recent Mortgage that was taken out on this home.
Original Mortgage
$250,000
Interest Rate
6.74%
Create a Home Valuation Report for This Property
The Home Valuation Report is an in-depth analysis detailing your home's value as well as a comparison with similar homes in the area
Home Values in the Area
Average Home Value in this Area
Purchase History
| Date | Buyer | Sale Price | Title Company |
|---|---|---|---|
| Chernin Wayne | $350,000 | -- |
Source: Public Records
Mortgage History
| Date | Status | Borrower | Loan Amount |
|---|---|---|---|
| Previous Owner | Chernin Wayne | $250,000 |
Source: Public Records
Tax History Compared to Growth
Tax History
| Year | Tax Paid | Tax Assessment Tax Assessment Total Assessment is a certain percentage of the fair market value that is determined by local assessors to be the total taxable value of land and additions on the property. | Land | Improvement |
|---|---|---|---|---|
| 2025 | $11,708 | $650,100 | $377,700 | $272,400 |
| 2024 | $11,556 | $602,900 | $344,100 | $258,800 |
Source: Public Records
Map
Nearby Homes
- 17 E Main St
- 12 Glen Gary Dr
- 1 Dogwood Dr
- 26 Woodland Rd
- 11 Indian Hollow Rd
- 16 Galway Dr
- 39 Woodland Rd
- 18 Dean Rd
- 47 Woodland Rd
- 56 Woodland Rd
- 4 Ascot Ln
- 3 Old Orchard Terrace
- 5 Queens Ct
- 284 Mendham Rd
- 120 Mountainside Rd
- 22 Talmage Rd
- 182 Washington Valley Rd
- 5 Exmoor Dr
- 40 Mountain Ave
- 3 Exmoor Dr