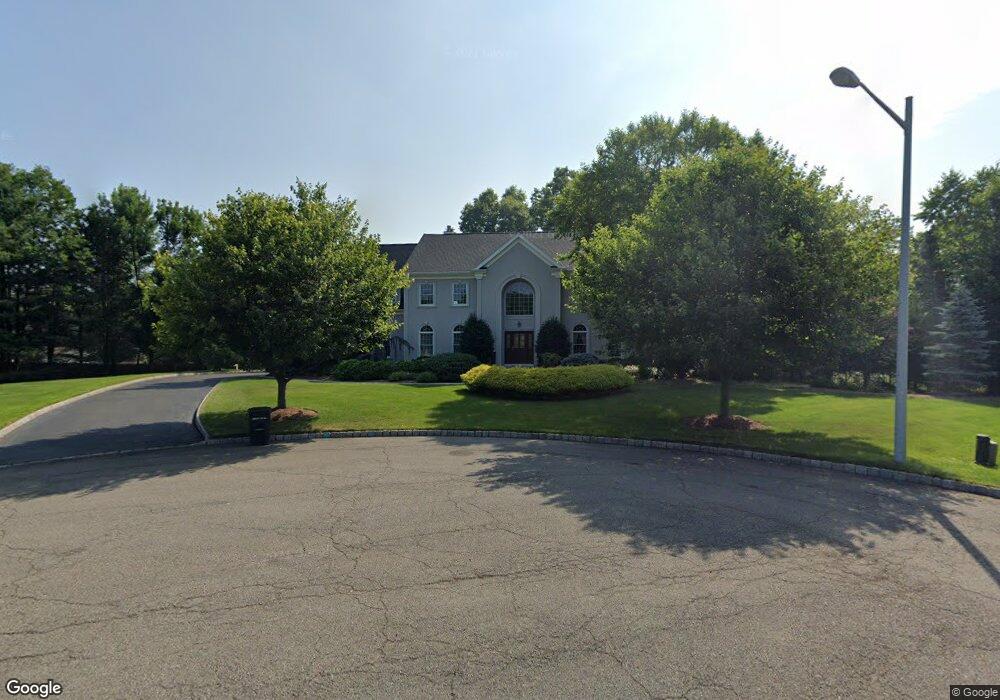
11 Cider Ct Mahwah, NJ 07430
Estimated Value: $1,684,000 - $2,161,000
--
Bed
--
Bath
4,610
Sq Ft
$412/Sq Ft
Est. Value
About This Home
This home is located at 11 Cider Ct, Mahwah, NJ 07430 and is currently estimated at $1,897,946, approximately $411 per square foot. 11 Cider Ct is a home located in Bergen County with nearby schools including Mahwah High School.
Ownership History
Date
Name
Owned For
Owner Type
Purchase Details
Closed on
Oct 9, 2001
Sold by
Appel Ridge Estates Llc
Bought by
Wong Richard and Wong Ping Y
Current Estimated Value
Home Financials for this Owner
Home Financials are based on the most recent Mortgage that was taken out on this home.
Original Mortgage
$275,000
Outstanding Balance
$106,150
Interest Rate
6.7%
Estimated Equity
$1,791,796
Create a Home Valuation Report for This Property
The Home Valuation Report is an in-depth analysis detailing your home's value as well as a comparison with similar homes in the area
Home Values in the Area
Average Home Value in this Area
Purchase History
| Date | Buyer | Sale Price | Title Company |
|---|---|---|---|
| Wong Richard | $975,000 | -- |
Source: Public Records
Mortgage History
| Date | Status | Borrower | Loan Amount |
|---|---|---|---|
| Open | Wong Richard | $275,000 |
Source: Public Records
Tax History Compared to Growth
Tax History
| Year | Tax Paid | Tax Assessment Tax Assessment Total Assessment is a certain percentage of the fair market value that is determined by local assessors to be the total taxable value of land and additions on the property. | Land | Improvement |
|---|---|---|---|---|
| 2025 | $22,188 | $1,075,000 | $339,500 | $735,500 |
| 2024 | $21,898 | $1,075,000 | $339,500 | $735,500 |
| 2023 | $21,199 | $1,075,000 | $339,500 | $735,500 |
| 2022 | $21,199 | $1,075,000 | $339,500 | $735,500 |
| 2021 | $20,964 | $1,075,000 | $339,500 | $735,500 |
| 2020 | $20,468 | $1,075,000 | $339,500 | $735,500 |
| 2019 | $22,806 | $1,238,800 | $339,500 | $899,300 |
| 2018 | $22,484 | $1,238,800 | $339,500 | $899,300 |
| 2017 | $22,125 | $1,238,800 | $339,500 | $899,300 |
| 2016 | $21,642 | $1,238,800 | $339,500 | $899,300 |
| 2015 | $21,345 | $1,238,800 | $339,500 | $899,300 |
| 2014 | $20,985 | $1,238,800 | $339,500 | $899,300 |
Source: Public Records
Map
Nearby Homes
- 49 Litchult Ln
- 39 Litchult Ln Unit 39
- 15 Roxbury Rd
- 277 Airmont Ave
- 1032 Castle Rd
- 30 Woodmere Rd
- 1034 Castle Rd
- 121 Surrey Ct
- 1023 Castle Rd
- 630 Fairfax Dr
- 659 Richmond Ct
- 190 Surrey Ct
- 339 Cambridge Dr
- 1114 Hyde Park Ct Unit 1114
- 5 Glengorra Ct
- 1088 Devon Ct
- 5 S Bayard Ln
- 1360 Oxford St Unit E1
- 19 Meadowbrook Rd
- 1103 Hilltop Rd
- 96 Masonicus Rd
- 15 Cider Ct
- 10 Cider Ct
- 230 E Crescent Ave
- 222 E Crescent Ave
- 238 E Crescent Ave
- 214 E Crescent Ave
- 189 Van Winkle Ln
- 188 Van Winkle Ln
- 80 Masonicus Rd
- 246 E Crescent Ave
- 250 E Crescent Ave
- 12 Aspen Ct
- 101 Masonicus Rd
- 225 E Crescent Ave
- 15 Aspen Ct
- 12 Bayberry Dr
- 68 Masonicus Rd
- 213 E Crescent Ave
- 249 E Crescent Ave