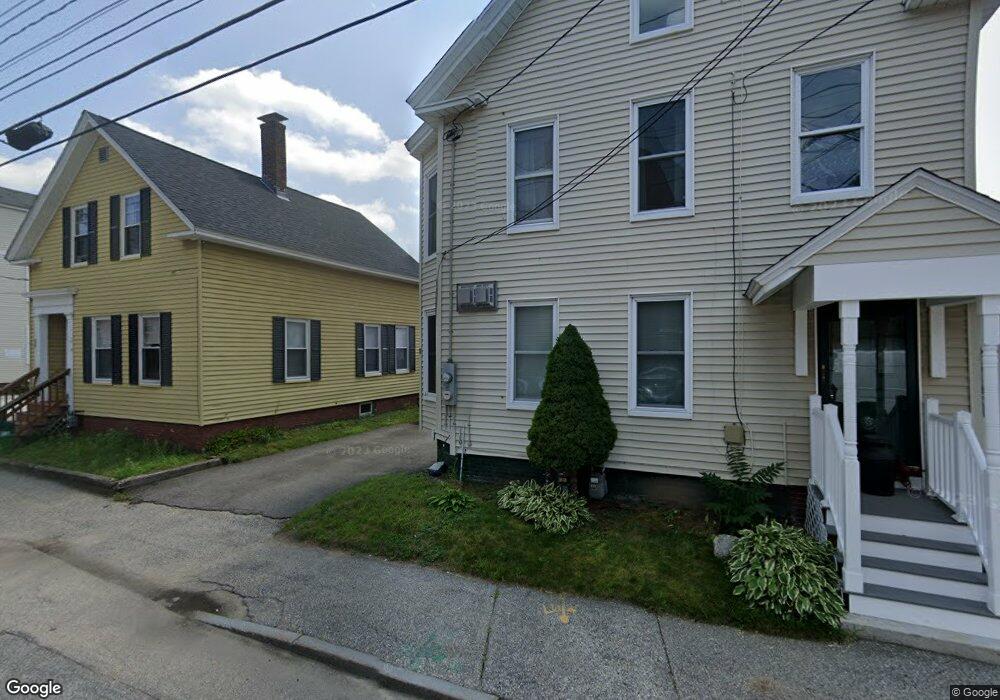
11 Concord St Unit 13 Concord, NH 03301
South End NeighborhoodEstimated Value: $455,000 - $501,000
2
Beds
2
Baths
1,817
Sq Ft
$265/Sq Ft
Est. Value
About This Home
This home is located at 11 Concord St Unit 13, Concord, NH 03301 and is currently estimated at $482,145, approximately $265 per square foot. 11 Concord St Unit 13 is a home located in Merrimack County with nearby schools including Christa McAuliffe School, Rundlett Middle School, and Concord High School.
Ownership History
Date
Name
Owned For
Owner Type
Purchase Details
Closed on
May 8, 2025
Sold by
Labrake Ft and Labrake
Bought by
Zou Zong M and Chen Qing
Current Estimated Value
Purchase Details
Closed on
Feb 20, 2024
Sold by
Harris Gayle
Bought by
Labrake Ft and Labrake
Home Financials for this Owner
Home Financials are based on the most recent Mortgage that was taken out on this home.
Original Mortgage
$300,000
Interest Rate
6.66%
Mortgage Type
Purchase Money Mortgage
Purchase Details
Closed on
May 26, 2022
Sold by
Groce Hazel
Bought by
Harris Gayle
Home Financials for this Owner
Home Financials are based on the most recent Mortgage that was taken out on this home.
Original Mortgage
$335,750
Interest Rate
5%
Mortgage Type
Purchase Money Mortgage
Purchase Details
Closed on
Sep 26, 2019
Sold by
D Mcleod Inc
Bought by
Groce Hazel V
Home Financials for this Owner
Home Financials are based on the most recent Mortgage that was taken out on this home.
Original Mortgage
$193,708
Interest Rate
3.6%
Mortgage Type
FHA
Create a Home Valuation Report for This Property
The Home Valuation Report is an in-depth analysis detailing your home's value as well as a comparison with similar homes in the area
Home Values in the Area
Average Home Value in this Area
Purchase History
| Date | Buyer | Sale Price | Title Company |
|---|---|---|---|
| Zou Zong M | $490,000 | None Available | |
| Zou Zong M | $490,000 | None Available | |
| Labrake Ft | $400,000 | None Available | |
| Labrake Ft | $400,000 | None Available | |
| Harris Gayle | $401,000 | None Available | |
| Harris Gayle | $401,000 | None Available | |
| Groce Hazel V | $164,533 | -- | |
| Groce Hazel V | $164,533 | -- |
Source: Public Records
Mortgage History
| Date | Status | Borrower | Loan Amount |
|---|---|---|---|
| Previous Owner | Labrake Ft | $300,000 | |
| Previous Owner | Harris Gayle | $335,750 | |
| Previous Owner | Groce Hazel V | $193,708 |
Source: Public Records
Tax History
| Year | Tax Paid | Tax Assessment Tax Assessment Total Assessment is a certain percentage of the fair market value that is determined by local assessors to be the total taxable value of land and additions on the property. | Land | Improvement |
|---|---|---|---|---|
| 2025 | $7,906 | $271,600 | $96,900 | $174,700 |
| 2024 | $7,521 | $271,600 | $96,900 | $174,700 |
| 2023 | $7,196 | $267,900 | $96,900 | $171,000 |
| 2022 | $6,936 | $267,900 | $96,900 | $171,000 |
| 2021 | $6,730 | $267,900 | $96,900 | $171,000 |
| 2020 | $6,002 | $224,300 | $77,300 | $147,000 |
| 2019 | $5,242 | $188,700 | $65,400 | $123,300 |
| 2018 | $6,154 | $218,300 | $65,400 | $152,900 |
| 2017 | $5,993 | $212,200 | $65,400 | $146,800 |
| 2016 | $5,409 | $195,500 | $65,400 | $130,100 |
| 2015 | $4,724 | $172,800 | $64,000 | $108,800 |
| 2014 | $4,633 | $172,800 | $64,000 | $108,800 |
| 2013 | -- | $161,400 | $64,000 | $97,400 |
| 2012 | $3,529 | $144,800 | $64,000 | $80,800 |
Source: Public Records
Map
Nearby Homes
- 58 S State St
- 47 South St
- 4 N Spring St
- 105 S Main St
- 11 Washington St
- 20 Carter St
- 1 Matthew St Unit 6
- 55 Tremont St
- 0 South St Unit 4969509
- 1 Kensington Rd
- 28 Stevens Dr
- 5 Broad Ave
- 22 Fairfield Dr
- 157 Rumford St
- 7 Highridge Trail
- 30 Penacook St
- 24 Hazel Dr
- 22 Longmeadow Dr
- 15 Bridle Path Trail
- 5 Ormond St
- 11-13 Concord St Unit 13
- 11-13 Concord St Unit 11
- 11 Lake St Unit 11
- 9 Concord St
- 5 Concord St
- 37 Concord St
- 46 S Main St
- 46 S Main St
- 46 S Main St Unit 5
- 46 S Main St Unit 6
- 46 S Main St Unit U-1
- 46 S Main St Unit 1, 2
- 46 S Main St Unit 2
- 46 S Main St Unit 7
- 44 S State St
- 48 S State St
- 40 S State St Unit 42
- 44-46 S State St
- 48 S Main St
- 48 S Main St Unit A/B
Your Personal Tour Guide
Ask me questions while you tour the home.