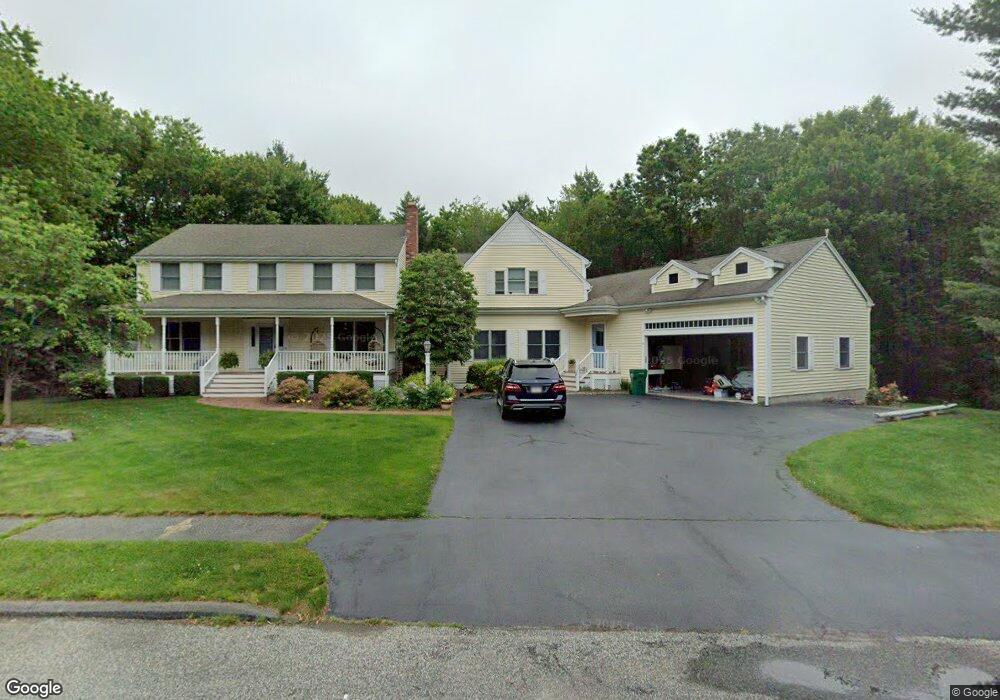
11 Danielle Ln Mansfield, MA 02048
Estimated Value: $1,030,000 - $1,370,000
6
Beds
5
Baths
4,263
Sq Ft
$283/Sq Ft
Est. Value
About This Home
This home is located at 11 Danielle Ln, Mansfield, MA 02048 and is currently estimated at $1,204,726, approximately $282 per square foot. 11 Danielle Ln is a home located in Bristol County with nearby schools including Everett W. Robinson Elementary School, Jordan/Jackson Elementary School, and Harold L. Qualters Middle School.
Ownership History
Date
Name
Owned For
Owner Type
Purchase Details
Closed on
Jun 2, 1994
Sold by
Hickey Alan M and Hickey Marcia S
Bought by
Hastings Ginger W and Hastings Bradford K
Current Estimated Value
Home Financials for this Owner
Home Financials are based on the most recent Mortgage that was taken out on this home.
Original Mortgage
$200,000
Interest Rate
8.49%
Mortgage Type
Purchase Money Mortgage
Create a Home Valuation Report for This Property
The Home Valuation Report is an in-depth analysis detailing your home's value as well as a comparison with similar homes in the area
Home Values in the Area
Average Home Value in this Area
Purchase History
| Date | Buyer | Sale Price | Title Company |
|---|---|---|---|
| Hastings Ginger W | $224,500 | -- |
Source: Public Records
Mortgage History
| Date | Status | Borrower | Loan Amount |
|---|---|---|---|
| Open | Hastings Ginger W | $199,000 | |
| Closed | Hastings Ginger W | $208,600 | |
| Closed | Hastings Ginger W | $199,000 | |
| Closed | Hastings Ginger W | $200,000 |
Source: Public Records
Tax History
| Year | Tax Paid | Tax Assessment Tax Assessment Total Assessment is a certain percentage of the fair market value that is determined by local assessors to be the total taxable value of land and additions on the property. | Land | Improvement |
|---|---|---|---|---|
| 2025 | $13,227 | $1,004,300 | $279,400 | $724,900 |
| 2024 | $13,001 | $963,000 | $291,600 | $671,400 |
| 2023 | $12,381 | $878,700 | $291,600 | $587,100 |
| 2022 | $11,816 | $778,900 | $269,900 | $509,000 |
| 2021 | $11,879 | $773,400 | $225,000 | $548,400 |
| 2020 | $11,658 | $759,000 | $225,000 | $534,000 |
| 2019 | $11,053 | $726,200 | $187,400 | $538,800 |
| 2018 | $11,022 | $707,900 | $178,700 | $529,200 |
| 2017 | $10,341 | $688,500 | $173,700 | $514,800 |
| 2016 | $9,890 | $641,800 | $165,300 | $476,500 |
| 2015 | $9,577 | $617,900 | $165,300 | $452,600 |
Source: Public Records
Map
Nearby Homes
- 1 Deer Path Ln
- 7 Fieldstone Dr
- 14 Windchime Dr
- 19 Barberry Rd
- 97 East St
- 44 Fairfield Park Unit 44
- 16 Holly Rd
- 28 Court St
- 46 Hope St
- 122 Samoset Ave
- 150 Rumford Ave Unit 110
- 22 Pleasant St Unit B
- 250 Mansfield Ave Unit 11
- 21 Juniper Rd
- 212 Mill St
- 631 East St Unit L101
- 166 Chauncy St
- 25 Kingman Ave
- 268 Reservoir St
- 0 Brook Pkwy
Your Personal Tour Guide
Ask me questions while you tour the home.