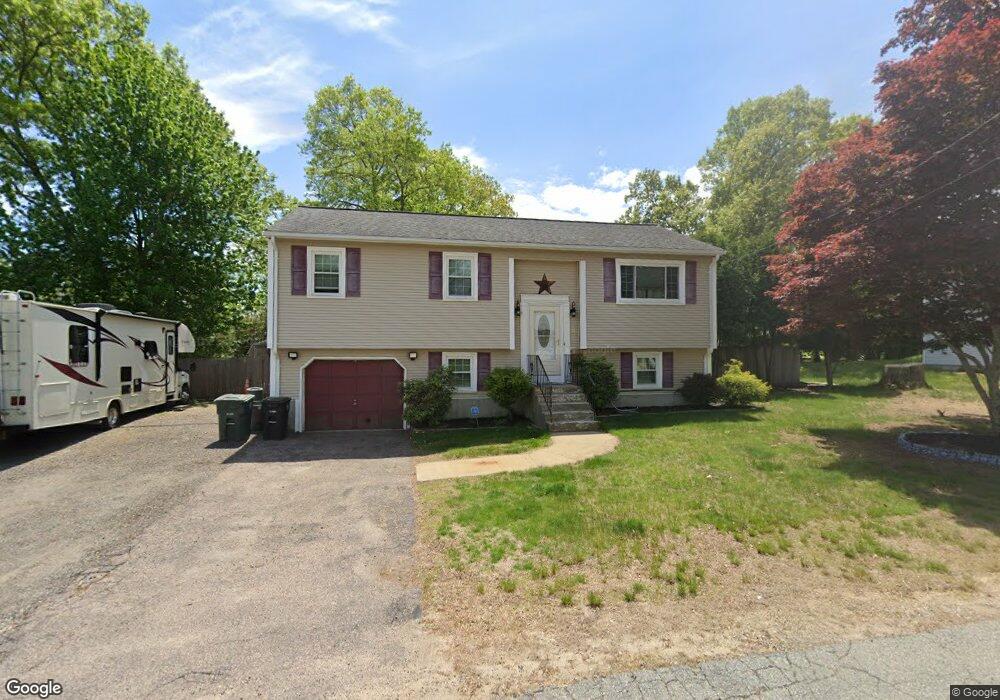
11 Doris St Coventry, RI 02816
West Warwick Centre NeighborhoodEstimated Value: $408,000 - $471,000
3
Beds
2
Baths
1,617
Sq Ft
$269/Sq Ft
Est. Value
About This Home
This home is located at 11 Doris St, Coventry, RI 02816 and is currently estimated at $435,290, approximately $269 per square foot. 11 Doris St is a home located in Kent County with nearby schools including Alan Shawn Feinstein Ms Of Cov, Coventry High School, and Islamic School of Rhode Island.
Ownership History
Date
Name
Owned For
Owner Type
Purchase Details
Closed on
May 9, 2011
Sold by
Fnma
Bought by
Hall Norman E and Hall Shelley J
Current Estimated Value
Home Financials for this Owner
Home Financials are based on the most recent Mortgage that was taken out on this home.
Original Mortgage
$169,589
Interest Rate
4.82%
Mortgage Type
Purchase Money Mortgage
Purchase Details
Closed on
Apr 28, 2011
Sold by
Mckenna Joetta L
Bought by
Fhlmc
Home Financials for this Owner
Home Financials are based on the most recent Mortgage that was taken out on this home.
Original Mortgage
$169,589
Interest Rate
4.82%
Mortgage Type
Purchase Money Mortgage
Purchase Details
Closed on
Aug 22, 2005
Sold by
Fontaine Roger D and Fontaine Jennifer L
Bought by
Mckenna John L and Mckenna Joetta L
Purchase Details
Closed on
Aug 9, 1996
Sold by
Cournoyer Richard J and Cournoyer Donna
Bought by
Fontaine Roger D and Fontaine Jennifer
Create a Home Valuation Report for This Property
The Home Valuation Report is an in-depth analysis detailing your home's value as well as a comparison with similar homes in the area
Home Values in the Area
Average Home Value in this Area
Purchase History
| Date | Buyer | Sale Price | Title Company |
|---|---|---|---|
| Hall Norman E | $174,000 | -- | |
| Fhlmc | $293,380 | -- | |
| Mckenna John L | $295,000 | -- | |
| Fontaine Roger D | $119,000 | -- |
Source: Public Records
Mortgage History
| Date | Status | Borrower | Loan Amount |
|---|---|---|---|
| Open | Fontaine Roger D | $172,000 | |
| Closed | Fontaine Roger D | $169,589 |
Source: Public Records
Tax History
| Year | Tax Paid | Tax Assessment Tax Assessment Total Assessment is a certain percentage of the fair market value that is determined by local assessors to be the total taxable value of land and additions on the property. | Land | Improvement |
|---|---|---|---|---|
| 2025 | $4,647 | $288,800 | $84,600 | $204,200 |
| 2024 | $4,640 | $292,900 | $84,600 | $208,300 |
| 2023 | $4,490 | $292,900 | $84,600 | $208,300 |
| 2022 | $4,188 | $214,000 | $82,700 | $131,300 |
| 2021 | $4,152 | $214,000 | $82,700 | $131,300 |
| 2020 | $4,742 | $213,200 | $82,700 | $130,500 |
| 2019 | $4,030 | $181,200 | $63,000 | $118,200 |
| 2018 | $3,916 | $181,200 | $63,000 | $118,200 |
| 2017 | $3,802 | $181,200 | $63,000 | $118,200 |
| 2016 | $3,657 | $170,800 | $61,900 | $108,900 |
| 2015 | $3,558 | $170,800 | $61,900 | $108,900 |
| 2014 | $3,483 | $170,800 | $61,900 | $108,900 |
| 2013 | $3,695 | $198,000 | $74,800 | $123,200 |
Source: Public Records
Map
Nearby Homes
Your Personal Tour Guide
Ask me questions while you tour the home.