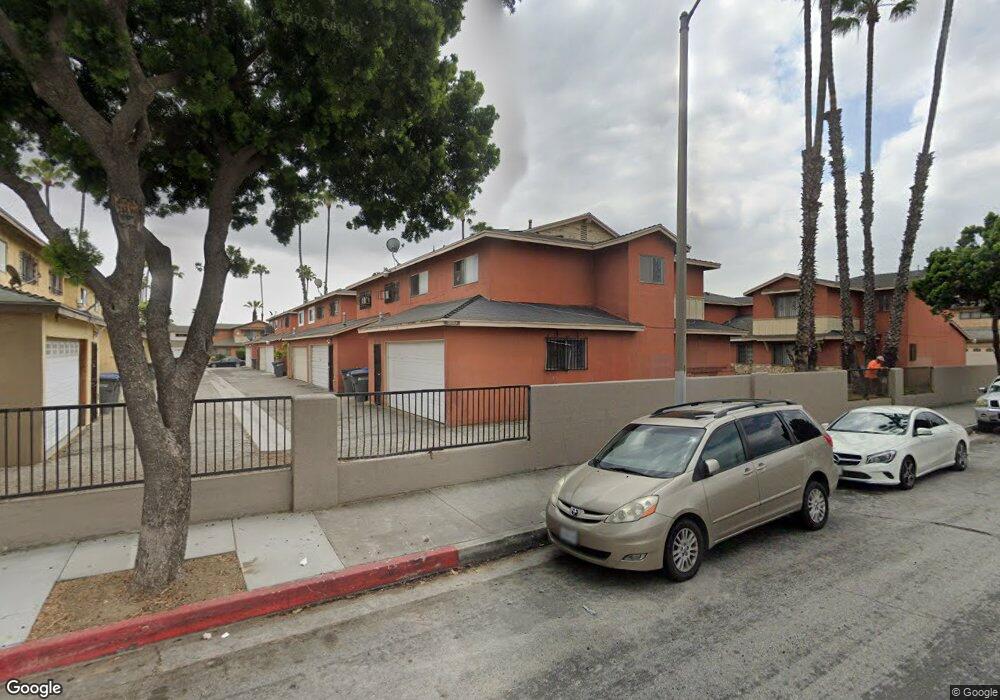
11 Dovecote Ln Carson, CA 90745
Estimated Value: $423,000 - $478,604
4
Beds
2
Baths
1,421
Sq Ft
$317/Sq Ft
Est. Value
About This Home
This home is located at 11 Dovecote Ln, Carson, CA 90745 and is currently estimated at $450,901, approximately $317 per square foot. 11 Dovecote Ln is a home located in Los Angeles County with nearby schools including Catskill Avenue Elementary School, Wilmington Middle School STEAM Magnet, and Andrew Carnegie Middle School.
Ownership History
Date
Name
Owned For
Owner Type
Purchase Details
Closed on
Jun 2, 2010
Sold by
Echeverria Maria E
Bought by
Ko Liz
Current Estimated Value
Purchase Details
Closed on
Jan 17, 2007
Sold by
Lu Jessy T
Bought by
Echeverria Maria E
Home Financials for this Owner
Home Financials are based on the most recent Mortgage that was taken out on this home.
Original Mortgage
$268,000
Interest Rate
6.75%
Mortgage Type
Purchase Money Mortgage
Purchase Details
Closed on
Jun 16, 2004
Sold by
Ruiz Luis and Ruiz Dolores
Bought by
Lu Jessy T
Home Financials for this Owner
Home Financials are based on the most recent Mortgage that was taken out on this home.
Original Mortgage
$156,600
Interest Rate
7.1%
Mortgage Type
Purchase Money Mortgage
Create a Home Valuation Report for This Property
The Home Valuation Report is an in-depth analysis detailing your home's value as well as a comparison with similar homes in the area
Home Values in the Area
Average Home Value in this Area
Purchase History
| Date | Buyer | Sale Price | Title Company |
|---|---|---|---|
| Ko Liz | $100,000 | Orange Coast Title | |
| Echeverria Maria E | $335,000 | Chicago Title Co | |
| Lu Jessy T | $175,000 | First American Title Co Los |
Source: Public Records
Mortgage History
| Date | Status | Borrower | Loan Amount |
|---|---|---|---|
| Previous Owner | Echeverria Maria E | $268,000 | |
| Previous Owner | Lu Jessy T | $156,600 |
Source: Public Records
Tax History
| Year | Tax Paid | Tax Assessment Tax Assessment Total Assessment is a certain percentage of the fair market value that is determined by local assessors to be the total taxable value of land and additions on the property. | Land | Improvement |
|---|---|---|---|---|
| 2025 | $2,314 | $129,068 | $51,627 | $77,441 |
| 2024 | $2,314 | $126,538 | $50,615 | $75,923 |
| 2023 | $2,262 | $124,058 | $49,623 | $74,435 |
| 2022 | $2,155 | $121,626 | $48,650 | $72,976 |
| 2021 | $2,119 | $119,243 | $47,697 | $71,546 |
| 2019 | $2,030 | $115,708 | $46,283 | $69,425 |
| 2018 | $1,983 | $113,440 | $45,376 | $68,064 |
| 2016 | $1,895 | $109,037 | $43,615 | $65,422 |
| 2015 | $1,850 | $107,400 | $42,960 | $64,440 |
| 2014 | $1,846 | $105,297 | $42,119 | $63,178 |
Source: Public Records
Map
Nearby Homes
- 11 Eastridge Ln
- 41 Scottsdale S
- 2 Jackrabbit Ln
- 40 Camelback Ave S Unit 46
- 23220 Colony Park Dr
- 23616 Panama Ave
- 624 E Pacific St
- 832 E Pacific St
- 22960 Mission Dr
- 22729 Marbella Ave
- 618 E 225th St
- 445 E 248th St
- 22108 Avalon Blvd
- 22719 Gulf Ave
- 208 W 234th Place
- 563 E 223rd St
- 535 E 223rd St Unit 12
- 22025 Garston Ave
- 536 E 220th St
- 325 E 222nd St
- 9 Dovecote Ln
- 7 Dovecote Ln Unit 362
- 7 Dovecote Ln
- 12 Coyote Ln
- 10 Dovecote Ln
- 10 Coyote Ln Unit 357
- 10 Coyote Ln
- 5 Dovecote Ln Unit 361
- 5 Dovecote Ln
- 8 Coyote Ln
- 8 Dovecote Ln
- 6 Dovecote Ln
- 3 Dovecote Ln
- 6 Coyote Ln
- 4 Dovecote Ln Unit 366
- 4 Coyote Ln Unit 354
- 4 Coyote Ln
- 1 Dovecote Ln Unit 359
- 1 Dovecote Ln
- 9 Eastridge Ln
Your Personal Tour Guide
Ask me questions while you tour the home.