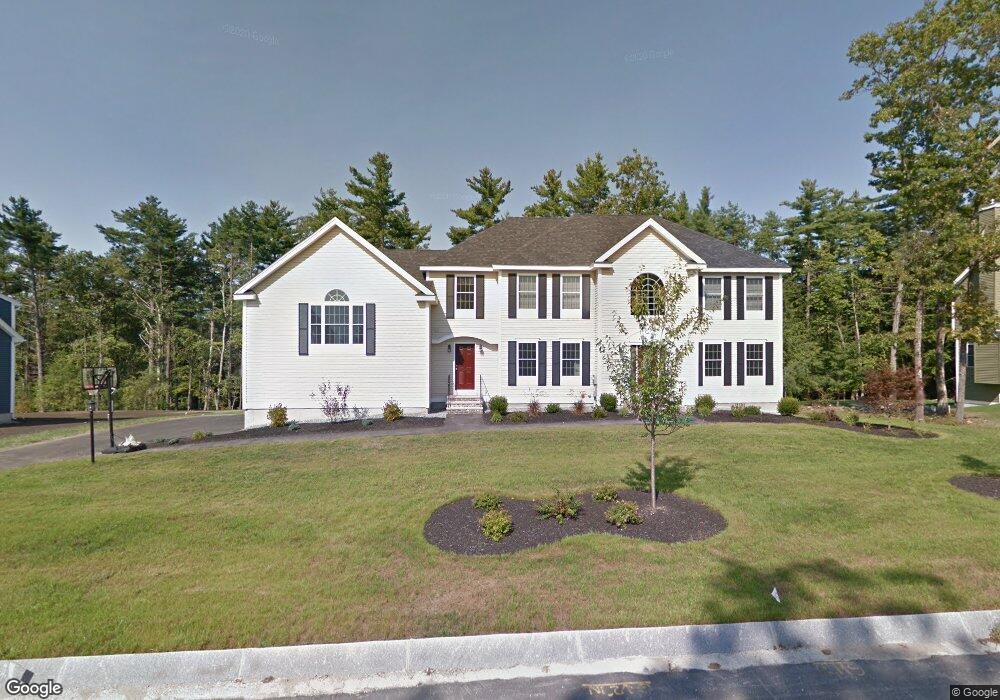
11 Eagles Nest Ridge Salem, NH 03079
Millville NeighborhoodEstimated Value: $1,163,000 - $1,328,000
4
Beds
3
Baths
3,902
Sq Ft
$319/Sq Ft
Est. Value
About This Home
This home is located at 11 Eagles Nest Ridge, Salem, NH 03079 and is currently estimated at $1,245,293, approximately $319 per square foot. 11 Eagles Nest Ridge is a home located in Rockingham County with nearby schools including William T. Barron Elementary School, Woodbury School, and Salem High School.
Ownership History
Date
Name
Owned For
Owner Type
Purchase Details
Closed on
Dec 7, 2011
Sold by
Dhb Homes Llc
Bought by
Devir Stephen J and Brissenden Michele
Current Estimated Value
Home Financials for this Owner
Home Financials are based on the most recent Mortgage that was taken out on this home.
Original Mortgage
$417,000
Interest Rate
4.09%
Mortgage Type
Purchase Money Mortgage
Purchase Details
Closed on
Nov 24, 2010
Sold by
Bank Of New England
Bought by
Dnb Homes Llc
Home Financials for this Owner
Home Financials are based on the most recent Mortgage that was taken out on this home.
Original Mortgage
$735,000
Interest Rate
4.25%
Mortgage Type
Purchase Money Mortgage
Purchase Details
Closed on
Aug 20, 2010
Sold by
Castle Ridge Llc and Bank Of New England
Bought by
Bank Of New England
Create a Home Valuation Report for This Property
The Home Valuation Report is an in-depth analysis detailing your home's value as well as a comparison with similar homes in the area
Home Values in the Area
Average Home Value in this Area
Purchase History
| Date | Buyer | Sale Price | Title Company |
|---|---|---|---|
| Devir Stephen J | $563,000 | -- | |
| Dnb Homes Llc | $735,000 | -- | |
| Bank Of New England | $550,000 | -- |
Source: Public Records
Mortgage History
| Date | Status | Borrower | Loan Amount |
|---|---|---|---|
| Open | Bank Of New England | $417,000 | |
| Closed | Bank Of New England | $417,000 | |
| Previous Owner | Bank Of New England | $735,000 |
Source: Public Records
Tax History Compared to Growth
Tax History
| Year | Tax Paid | Tax Assessment Tax Assessment Total Assessment is a certain percentage of the fair market value that is determined by local assessors to be the total taxable value of land and additions on the property. | Land | Improvement |
|---|---|---|---|---|
| 2024 | $14,800 | $840,900 | $261,300 | $579,600 |
| 2023 | $14,262 | $840,900 | $261,300 | $579,600 |
| 2022 | $13,496 | $840,900 | $261,300 | $579,600 |
| 2021 | $13,438 | $840,900 | $261,300 | $579,600 |
| 2020 | $13,789 | $626,200 | $186,300 | $439,900 |
| 2019 | $13,764 | $626,200 | $186,300 | $439,900 |
| 2018 | $13,532 | $626,200 | $186,300 | $439,900 |
| 2017 | $12,439 | $596,900 | $186,300 | $410,600 |
| 2016 | $12,195 | $596,900 | $186,300 | $410,600 |
| 2015 | $11,219 | $524,500 | $156,500 | $368,000 |
| 2014 | $10,904 | $524,500 | $156,500 | $368,000 |
| 2013 | $10,731 | $524,500 | $156,500 | $368,000 |
Source: Public Records
Map
Nearby Homes
- 12 Braemoor Woods Rd Unit 206
- 4 Mulberry Rd
- 59 Cluff Rd Unit 50
- 59 Cluff Rd Unit 7
- 59 Cluff Rd Unit 41
- 10 Sally Sweets Way Unit V104
- 15 Linwood Ave
- 35 Fraser Dr
- 11 Tiffany Rd Unit 1
- 6 Lancelot Ct Unit 2
- 30 Hagop Rd
- 117 Cluff Crossing Rd Unit 7
- 10 Evelyn Rd
- 8 Senter St
- 89 End St
- 17 Meredith Rd
- 8 Alta Ave
- 6 Douglas Dr
- 139 North St
- 11 Maclarnon Rd
- 9 Eagles Nest Ridge
- 9 Eagles Nest Ridge
- 13 Eagles Nest Ridge
- 7 Eagles Nest Ridge
- 7 Eagles Nest Ridge
- 12 Eagles Nest Ridge
- 10 Eagles Nest Ridge
- 14 Eagles Nest Ridge
- 10 Eagles Nest Ridge
- 5 Eagles Nest Ridge
- lot 7909 Eagle's Nest Ridge
- 8 Eagles Nest Ridge
- 18 Eagles Nest Ridge
- 3 Eagles Nest Ridge
- 6 Eagles Nest Ridge
- 6 Eagles Nest Ridge
- 115 Lawrence Rd
- 111 Lawrence Rd
- 117 Lawrence Rd
- 113 Lawrence Rd