B
Seller's Agent in 2013
Bill Rossi
Studio Realty


Estimated Value: $4,843,000 - $6,961,349
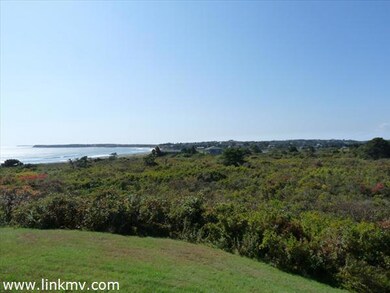
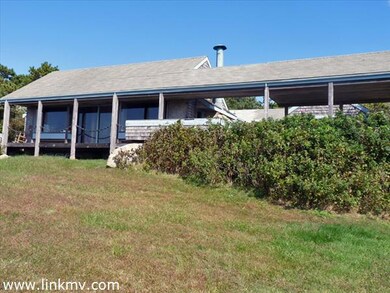
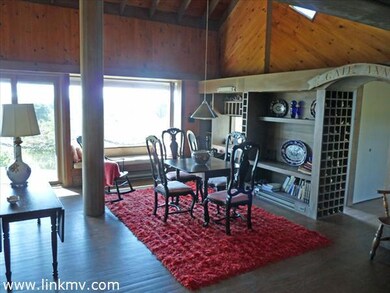
Dramatic views of Squibnocket Ridge, Aquinnah and Nomans Land from this protected hillside property located at stonewall Beach in Chilmark. This modest three bedroom home is reminiscent of a by-gone era that immediately prompts one to decompress in its simplicity. Keep things as they are or plan your new home to accommodate your new family gathering place. There is a new six bedroom septic system plan that has been approved along with a new well. This home is part of the Stonewall Beach Association
Last Agent to Sell the Property
Bill Rossi
Studio Realty Listed on: 08/09/2012
Last Buyer's Agent
Julianna Flanders
Flanders Real Estate
| Date | Buyer | Sale Price | Title Company |
|---|---|---|---|
| East Lane Nt | $3,800,000 | -- | |
| Moses Peter T | $752,800 | -- | |
| Moses | -- | -- | |
| Moses Oliver Taft | -- | -- | |
| Moses Peter T | $625,000 | -- |
| Date | Event | Price | List to Sale | Price per Sq Ft |
|---|---|---|---|---|
| 09/10/2013 09/10/13 | Sold | $3,800,000 | -43.7% | $2,250 / Sq Ft |
| 07/26/2013 07/26/13 | Pending | -- | -- | -- |
| 08/09/2012 08/09/12 | For Sale | $6,750,000 | -- | $3,996 / Sq Ft |
| Year | Tax Paid | Tax Assessment Tax Assessment Total Assessment is a certain percentage of the fair market value that is determined by local assessors to be the total taxable value of land and additions on the property. | Land | Improvement |
|---|---|---|---|---|
| 2025 | $21,010 | $9,337,700 | $4,551,100 | $4,786,600 |
| 2024 | $20,638 | $9,735,000 | $4,377,100 | $5,357,900 |
| 2023 | $19,932 | $7,578,800 | $3,388,500 | $4,190,300 |
| 2022 | $18,627 | $6,605,300 | $3,187,600 | $3,417,700 |
| 2021 | $17,814 | $6,121,800 | $3,187,600 | $2,934,200 |
| 2020 | $17,263 | $6,036,000 | $3,127,300 | $2,908,700 |
| 2019 | $16,811 | $5,837,200 | $3,127,300 | $2,709,900 |
| 2018 | $16,052 | $5,837,200 | $3,127,300 | $2,709,900 |
| 2017 | $15,565 | $5,808,000 | $3,124,000 | $2,684,000 |
| 2016 | $15,669 | $5,781,900 | $3,124,000 | $2,657,900 |
| 2015 | $15,206 | $5,781,900 | $3,124,000 | $2,657,900 |
| 2014 | $8,800 | $3,548,400 | $3,386,000 | $162,400 |
B
Seller's Agent in 2013
Bill Rossi
Studio Realty
J
Buyer's Agent in 2013
Julianna Flanders
Flanders Real Estate
Source: LINK (Vineyard)
MLS Number: 23668
APN: CHIL-000032-000000-000072