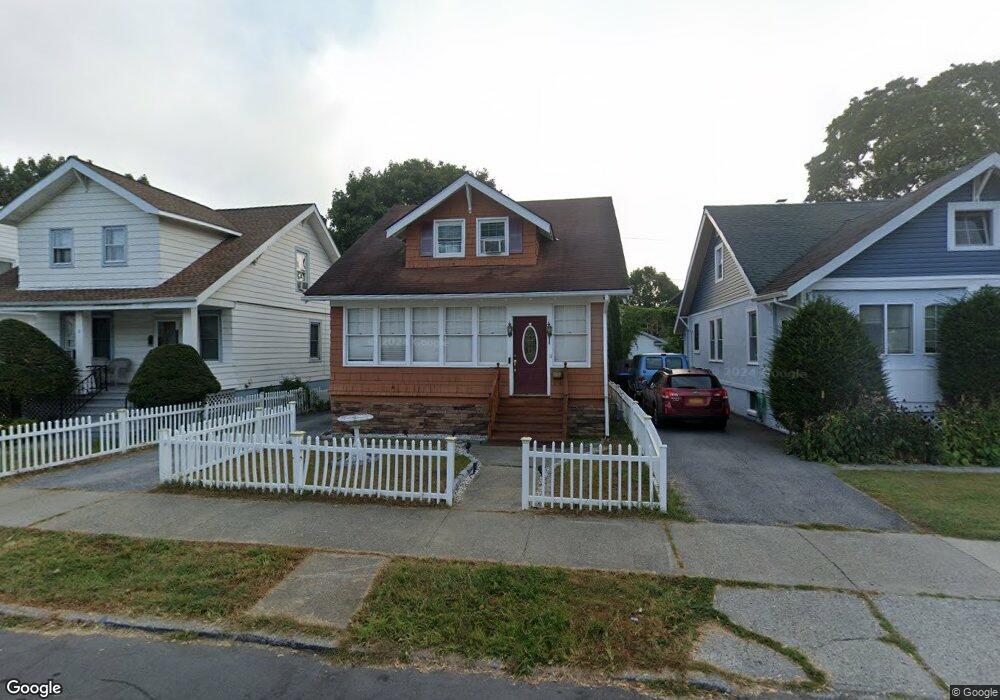
11 Edger St Poughkeepsie City, NY 12603
Estimated Value: $317,000 - $367,000
3
Beds
1
Bath
1,150
Sq Ft
$290/Sq Ft
Est. Value
About This Home
This home is located at 11 Edger St, Poughkeepsie City, NY 12603 and is currently estimated at $333,260, approximately $289 per square foot. 11 Edger St is a home located in Dutchess County with nearby schools including Poughkeepsie High School, Holy Trinity School, and Tabernacle Christian Academy.
Ownership History
Date
Name
Owned For
Owner Type
Purchase Details
Closed on
Oct 15, 2021
Sold by
Malcolm Brian O and Malcolm Zilphia E
Bought by
Mane Oumar and Touray Mariana
Current Estimated Value
Home Financials for this Owner
Home Financials are based on the most recent Mortgage that was taken out on this home.
Original Mortgage
$294,566
Outstanding Balance
$268,617
Interest Rate
2.8%
Mortgage Type
FHA
Estimated Equity
$64,643
Purchase Details
Closed on
Dec 20, 2002
Sold by
Breault Janet M
Bought by
Malcolm Brian O
Create a Home Valuation Report for This Property
The Home Valuation Report is an in-depth analysis detailing your home's value as well as a comparison with similar homes in the area
Home Values in the Area
Average Home Value in this Area
Purchase History
| Date | Buyer | Sale Price | Title Company |
|---|---|---|---|
| Mane Oumar | $300,000 | None Available | |
| Mane Oumar | $300,000 | None Available | |
| Malcolm Brian O | $135,000 | David A Sears | |
| Malcolm Brian O | $135,000 | David A Sears |
Source: Public Records
Mortgage History
| Date | Status | Borrower | Loan Amount |
|---|---|---|---|
| Open | Mane Oumar | $294,566 | |
| Closed | Mane Oumar | $294,566 |
Source: Public Records
Tax History Compared to Growth
Tax History
| Year | Tax Paid | Tax Assessment Tax Assessment Total Assessment is a certain percentage of the fair market value that is determined by local assessors to be the total taxable value of land and additions on the property. | Land | Improvement |
|---|---|---|---|---|
| 2024 | $7,775 | $257,200 | $59,400 | $197,800 |
| 2023 | $9,400 | $247,300 | $59,400 | $187,900 |
| 2022 | $5,454 | $215,000 | $54,000 | $161,000 |
| 2021 | $4,761 | $179,200 | $54,000 | $125,200 |
| 2020 | $4,314 | $149,300 | $54,000 | $95,300 |
| 2019 | $4,161 | $135,700 | $54,000 | $81,700 |
| 2018 | $3,859 | $129,200 | $54,000 | $75,200 |
| 2017 | $3,720 | $126,700 | $54,000 | $72,700 |
| 2016 | $3,624 | $125,400 | $54,000 | $71,400 |
| 2015 | -- | $125,400 | $54,000 | $71,400 |
| 2014 | -- | $121,700 | $54,000 | $67,700 |
Source: Public Records
Map
Nearby Homes