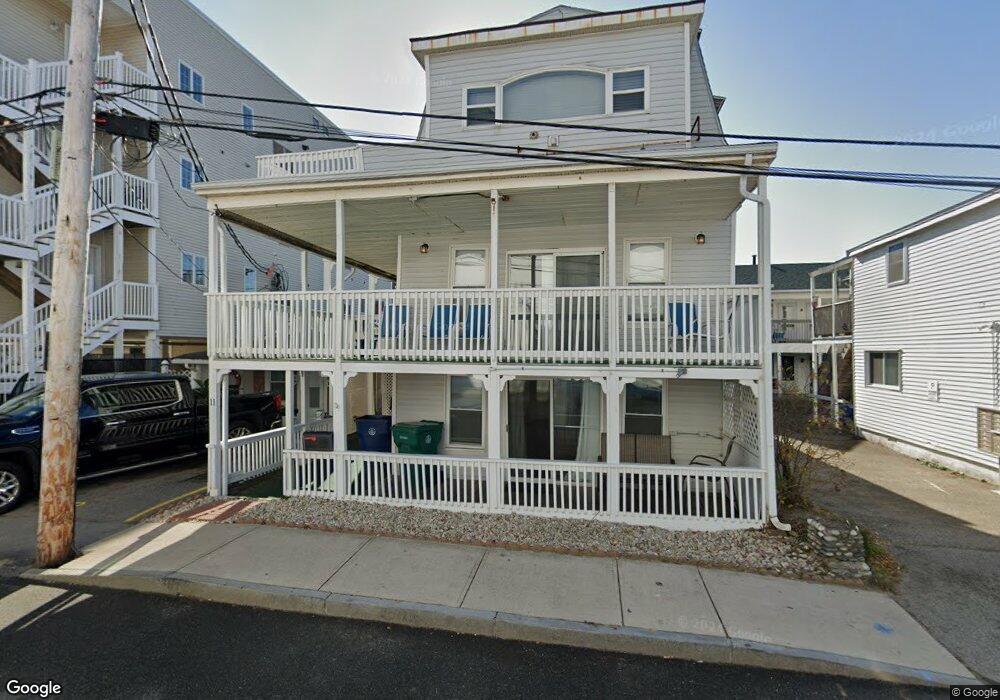
11 F St Unit 287-39 Hampton, NH 03842
--
Bed
--
Bath
476
Sq Ft
4,792
Sq Ft Lot
About This Home
This home is located at 11 F St Unit 287-39, Hampton, NH 03842. 11 F St Unit 287-39 is a home located in Rockingham County with nearby schools including Hampton Centre School, Adeline C. Marston Elementary School, and Hampton Academy.
Ownership History
Date
Name
Owned For
Owner Type
Purchase Details
Closed on
Nov 14, 2019
Sold by
Fawlty Towers Properties
Bought by
Karens Llc
Home Financials for this Owner
Home Financials are based on the most recent Mortgage that was taken out on this home.
Original Mortgage
$635,000
Outstanding Balance
$557,517
Interest Rate
3.5%
Mortgage Type
Purchase Money Mortgage
Purchase Details
Closed on
Dec 15, 2017
Sold by
Sea & Sand Llc
Bought by
Fawlty Towers Properti
Home Financials for this Owner
Home Financials are based on the most recent Mortgage that was taken out on this home.
Original Mortgage
$458,416
Interest Rate
3.94%
Mortgage Type
Purchase Money Mortgage
Purchase Details
Closed on
Jun 11, 2010
Sold by
Paquin Richard M and Paquin Colette
Bought by
Sea & Sand Llc
Home Financials for this Owner
Home Financials are based on the most recent Mortgage that was taken out on this home.
Original Mortgage
$442,500
Interest Rate
5.11%
Mortgage Type
Commercial
Purchase Details
Closed on
Mar 26, 2002
Sold by
Chaput Peter L and Chaput Judith E
Bought by
Paquin Richard M and Paquin Colette
Create a Home Valuation Report for This Property
The Home Valuation Report is an in-depth analysis detailing your home's value as well as a comparison with similar homes in the area
Home Values in the Area
Average Home Value in this Area
Purchase History
| Date | Buyer | Sale Price | Title Company |
|---|---|---|---|
| Karens Llc | $615,000 | -- | |
| Fawlty Towers Properti | $573,133 | -- | |
| Fawlty Towers Properti | $573,133 | -- | |
| Sea & Sand Llc | $590,000 | -- | |
| Sea & Sand Llc | $590,000 | -- | |
| Paquin Richard M | $495,000 | -- | |
| Paquin Richard M | $495,000 | -- |
Source: Public Records
Mortgage History
| Date | Status | Borrower | Loan Amount |
|---|---|---|---|
| Open | Karens Llc | $635,000 | |
| Previous Owner | Fawlty Towers Properti | $458,416 | |
| Previous Owner | Paquin Richard M | $442,500 |
Source: Public Records
Tax History Compared to Growth
Tax History
| Year | Tax Paid | Tax Assessment Tax Assessment Total Assessment is a certain percentage of the fair market value that is determined by local assessors to be the total taxable value of land and additions on the property. | Land | Improvement |
|---|---|---|---|---|
| 2024 | $11,788 | $956,800 | $471,400 | $485,400 |
| 2023 | $12,159 | $725,900 | $332,200 | $393,700 |
| 2022 | $11,498 | $725,900 | $332,200 | $393,700 |
| 2021 | $11,498 | $725,900 | $332,200 | $393,700 |
| 2020 | $11,562 | $725,800 | $332,200 | $393,600 |
| 2019 | $11,620 | $725,800 | $332,200 | $393,600 |
| 2018 | $11,058 | $649,700 | $327,500 | $322,200 |
| 2017 | $10,636 | $649,700 | $327,500 | $322,200 |
| 2016 | $10,447 | $649,700 | $327,500 | $322,200 |
| 2015 | $10,584 | $552,400 | $297,700 | $254,700 |
| 2014 | $10,114 | $552,400 | $297,700 | $254,700 |
Source: Public Records
Map
Nearby Homes
- 19 F St
- 22 1/2 I St Unit 2
- 27 Hobson Ave
- 3 Perkins Ave Unit 1
- 17 Johnson Ave
- 27 Perkins Ave
- 10 Haverhill Ave Unit 1
- 10 Haverhill Ave Unit 2
- 19 Riverview Terrace
- 10 Kentville Terrace
- 12 Kentville Terrace
- 5 Fellows Ave
- 3 Harris Ave
- 73 Church St
- 15 Ocean Blvd
- 13 Ocean Blvd
- 13-15 Ocean Blvd
- 401A Ocean Blvd Unit 1
- 401A Ocean Blvd Unit 2
- 16 Bruce St